


DJIA Talking Points:
- US equities put in a recovery after the Christmas holiday, clawing back 38.2% of the December sell-off. That strength has held into the opening days of 2019 price action, but buyers appear thwarted at a confluent spot on the chart around the 23,330 area. This area houses the 38.2% marker of the December sell-off to go along with the 38.2% marker of the 2016-2018 bullish move; along with a series of prior support tests from Q1/Q2 of 2018.
- The primary issues appear to still be FOMC policy and Trade Tariffs; and with neither of these themes yet seeing resolution, traders can be rightfully cautious of chasing this week-long rally.
- DailyFX Forecasts on a variety of currencies such as the US Dollar or the Euro are available from the DailyFX Trading Guides page. If you’re looking to improve your trading approach, check out Traits of Successful Traders. And if you’re looking for an introductory primer to the Forex market, check out our New to FX Guide.
Do you want to see how retail traders are currently trading the US Dollar? Check out our IG Client Sentiment Indicator.
Post-Christmas Santa Rally Claws Back 38.2% of December Losses
US stocks got slammed in Q4, showing further signs of breakdown in December as the risk trade was flipped on its head. The prior ‘buy the dip’ theme turned into ‘sell the rip,’ and US equities limped into the holidays after being battered by bearish pressure brought upon by a plethora of themes. But the Christmas holiday appeared to be an important pivot, as traders returning from to their desks found a much friendlier market that was ready to rally in the final week of 2018 and into year-end.
That rally has now clawed back 38.2% of the bearish move that showed-up in December, and this Fibonacci level is confluent with another 38.2% marker as just a couple of points-higher on the chart brings the same retracement level from a longer-term study, produced by the 2016-2018 bullish trend.
Dow Jones Weekly Price Chart: At Confluent Resistance
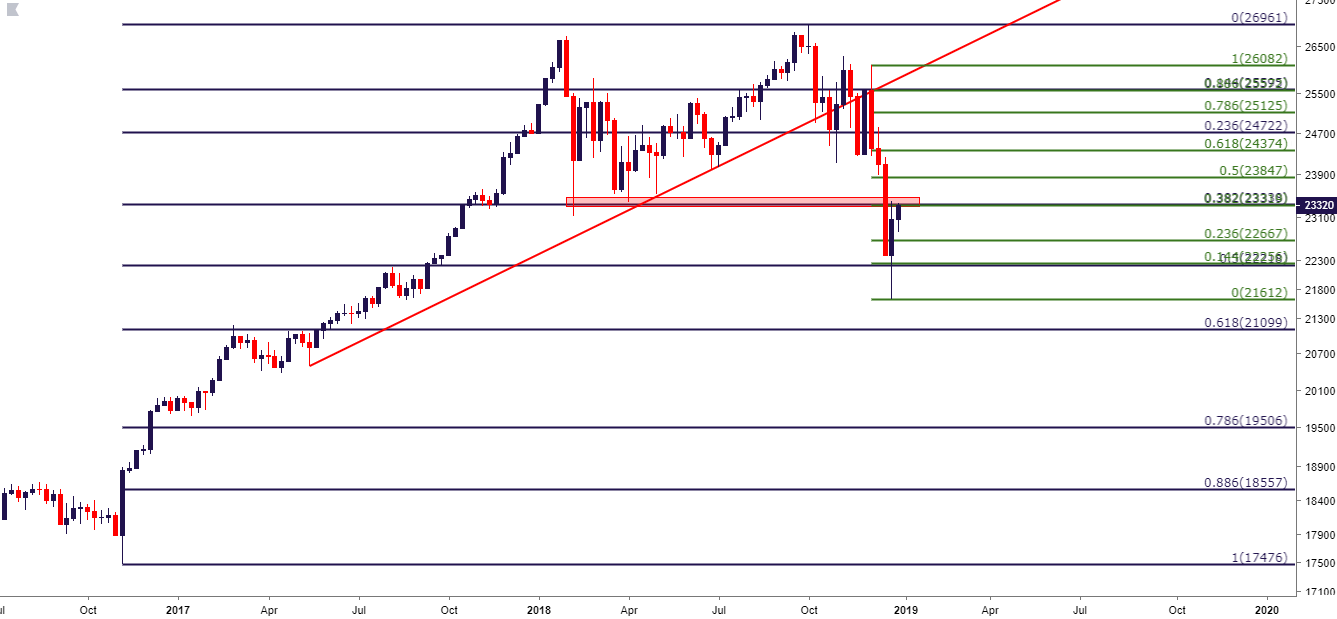
Chart prepared by James Stanley
Dow Jones: Is the Pain Over?
While the past week’s price action has been encouraging, there aren’t yet enough signs that US markets are out of the woods. Given the wall of worry that had shown up in Q4, a couple of particular items seemed to really weight on the mind of equity market participants; key of which was FOMC policy at the December rate decision. Also of interest is the continued tango on the tariff front; and neither of these themes have seen anything that appears to be final resolution.
Traders can be rightfully cautious of looking at bullish themes after last week’s bounce. For those looking at themes of strength in US stocks, the Dow Jones re-claiming ground above 23,850 could make that scenario look more attractive. This is around the 50% marker of the December sell-off, and this price could be extended up to 24k to produce a resistance zone; from which a topside break could re-open the door to bullish potential, looking for a re-test of the 25k area on the chart.
Until then, caution is the name of the game.
DJIA: Dow Jones Daily Price Chart
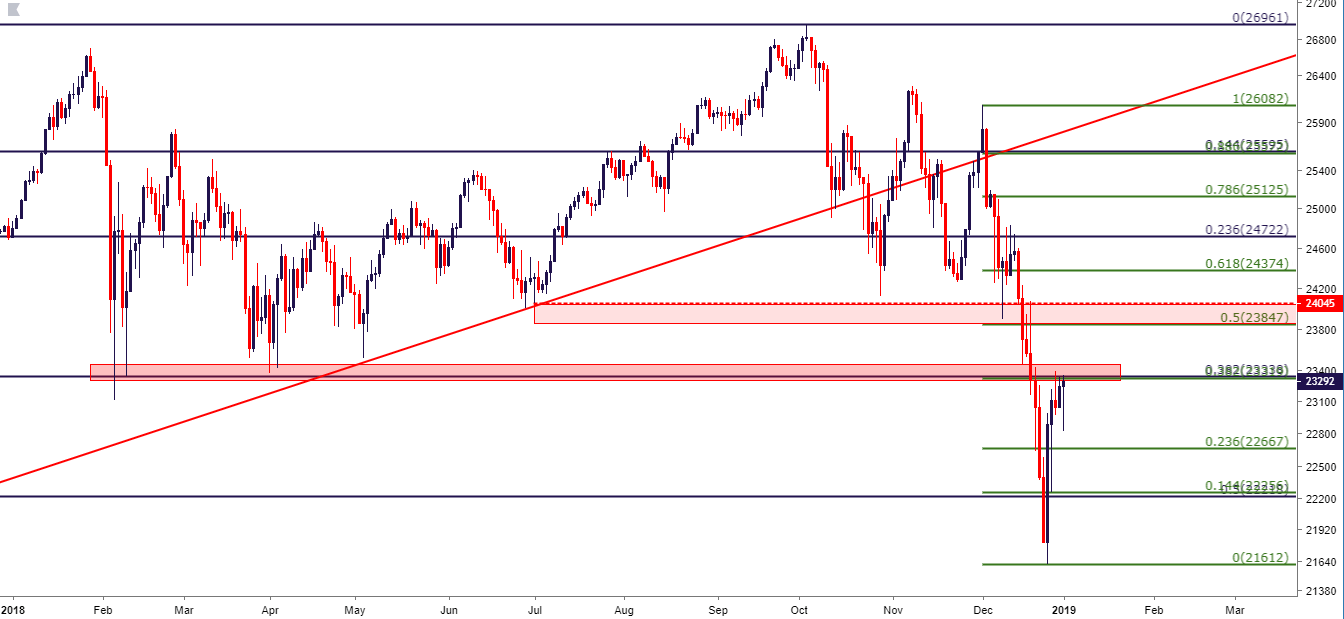
Chart prepared by James Stanley
You may also be interested in:
Day Trading the Dow Jones: Strategies, Tips & Trading Signals
To read more:
Are you looking for longer-term analysis on the U.S. Dollar? Our DailyFX Forecasts for Q4 have a section for each major currency, and we also offer a plethora of resources on USD-pairs such as EUR/USD, GBP/USD, USD/JPY, AUD/USD. Traders can also stay up with near-term positioning via our IG Client Sentiment Indicator.
Forex Trading Resources
DailyFX offers a plethora of tools, indicators and resources to help traders. For those looking for trading ideas, our IG Client Sentiment shows the positioning of retail traders with actual live trades and positions. Our trading guides bring our DailyFX Quarterly Forecasts and our Top Trading Opportunities; and our real-time news feed has intra-day interactions from the DailyFX team. And if you’re looking for real-time analysis, our DailyFX Webinars offer numerous sessions each week in which you can see how and why we’re looking at what we’re looking at.
If you’re looking for educational information, our New to FX guide is there to help new(er) traders while our Traits of Successful Traders research is built to help sharpen the skill set by focusing on risk and trade management.
--- Written by James Stanley, Strategist for DailyFX.com
Contact and follow James on Twitter: @JStanleyFX
https://www.dailyfx.com/forex/technical/article/special_report/2018/09/07/The-dow-spends-a-week-at-support-will-bulls-follow-thru-srepstans.html


