


Technical Forecast for Dow, S&P, DAX, FTSE 100 and Nikkei
- US Dollar Pumps and Dumps, Stocks Surge as Markets Strike ‘Powell Put’
- Short-Term Technical Outlook for the S&P 500 and Dow Jones.
- Are you looking for longer-term analysis of Equity prices? Check out our Quarterly Forecasts as part of the DailyFX Trading Guides.
Stocks Recover After Powell Put Comes into Further View
Something that global markets have been waiting for appears to have gotten more confirmation this morning. While equity markets had a strong Q2 and Q3, the tides turned in the opening days of Q4 after FOMC Chair Jerome Powell took on a hawkish tone when discussing the bank’s proximity to the neutral rate. This implied that the Fed had plans for more rate hikes as the page turned into 2019, and in short-order the bullish breakouts that drove US stocks to fresh all-time-highs in early-October had turned around with aggression.
This caught more attention in late-November, when after seven weeks of pain across equity markets, Chair Powell opined that the bank was ‘just under’ the neutral rate, displaying a noticeable change to his earlier-October remarks and giving the idea that the Fed was becoming a bit more concerned with the volatility. This was offset, however, at the December FOMC rate decision when Powell implied that rate hikes were on autopilot, and that the bank looked to hike rates two more times in 2019. Sellers came back and that volatility lasted into the Christmas holiday.
At this morning’s event in which Chair Powell was joined by former Fed Chairs Janet Yellen and Ben Bernanke, Powell took an even softer tone; indicating that the bank could modify their outlooks and forecasts as market dynamics dictated, implying that even the balance sheet runoff could be modified if the bank so saw fit. This helped to provide a bullish bump into equities, and that theme appears ready to hold into the weekend.
Below, I look at five of the world’s largest equity bourses to devise strategy for next week.
Dow Jones Crosses Key Confluent Area on the Chart
I had written about this topic on Wednesday as the Dow Jones Industrial Average was catching resistance at a key level. This comes in around 23,300, and this area includes a pair of 38.2% Fibonacci retracements, combined with last year’s support after the Q1 pullback. That zone held the highs on Wednesday and Thursday, but the topside push following Powell’s comments earlier today finally helped buyers gain some ground above this key area on the chart. The forecast for the Dow will be set to bullish for next week, looking for continued recovery following what could’ve been an important pivot around Chair Powell’s comments earlier today.
Technical Forecast for the Dow Jones: Bullish
Dow Jones Four-Hour Price Chart
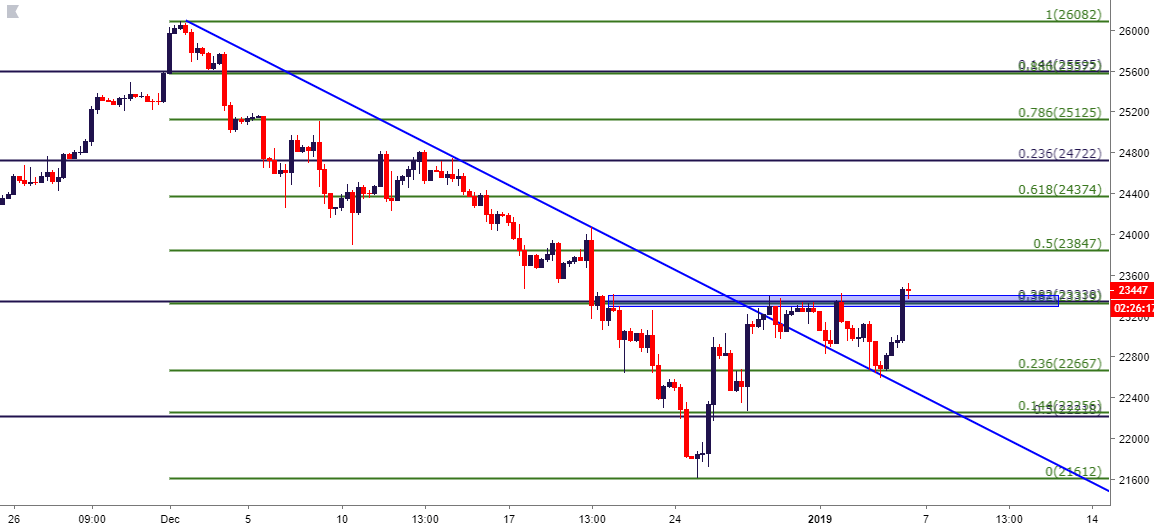
Chart prepared by James Stanley
S&P 500 Re-Takes 2500
Similar story on the S&P as to what was discussed above around the Dow. This week’s resistance in the S&P 500 was holding around a 38.2% Fibonacci retracement of a long-term major move; although to contrast this with the Dow, this 38.2% retracement in the S&P was coming from a longer-term study, taking the 2016 low up to the 2018 high. This price at 2508 had helped to hold resistance on the final two trading days of 2018 and the first day of the New Year; but this morning’s bullish push has finally made a move above this level as the index pushes up to fresh two-week-highs. The forecast will be set to bullish here as well, looking for continued recovery following Chair Powell’s remarks earlier this morning.
Technical Forecast for the S&P 500: Bullish
S&P 500 Four-Hour Price Chart
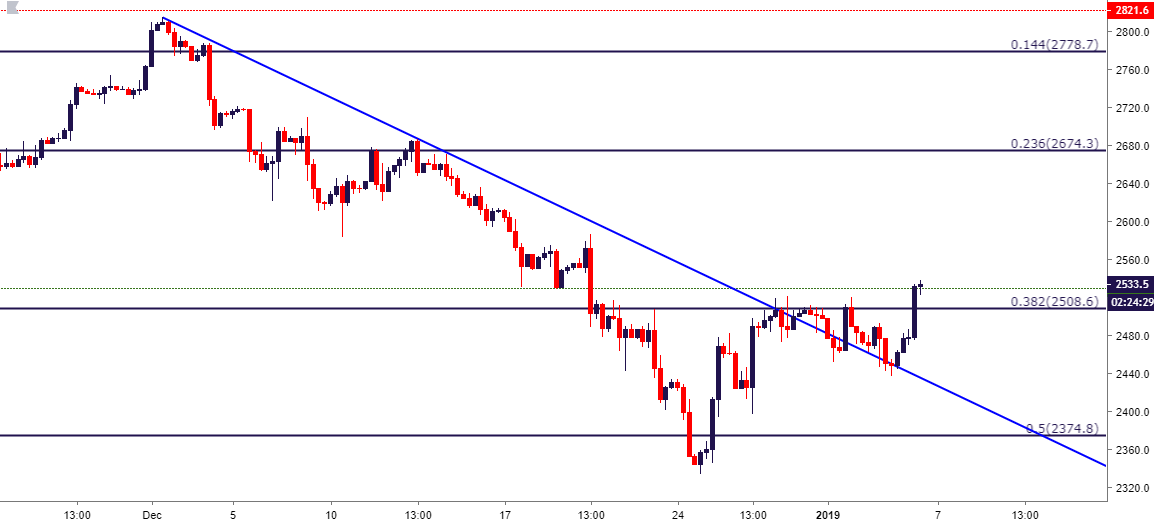
Chart prepared by James Stanley
DAX May Not Yet Be Ready for a 10K Test
My choice for equity weakness through most of Q4 was the DAX, and this theme ran fairly well into the end of 2018. Sellers have started to get shy, however, as price action in the index neared the 10k psychological level, and this has led into a build of support around 10,400 that sellers haven’t yet been able to leave behind. While the trend remains attractive here, this market still appears to be oversold, and there could be deeper retracement potential before the short-side theme is ready for continuation. Of particular note is the under-side of a prior bullish trend-line, which is nearing confluence with the 50% marker of the 2016-2018 major move. A re-test there could re-open the door for bearish strategies; but until then or until something else changes, the technical forecast will be set to neutral.
Technical Forecast for the DAX: Neutral
DAX Monthly Price Chart
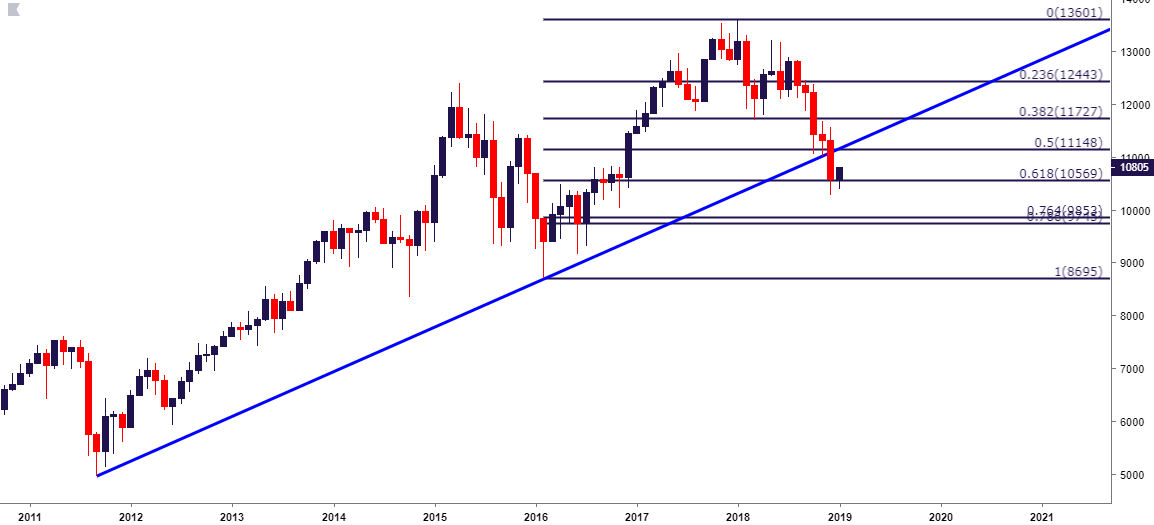
Chart prepared by James Stanley
FTSE 100 Tests Resistance at Prior Support
The level of 6850 was a key area on the chart for the FTSE 100 in 2018. This price helped to set the low in March, producing an aggressive reversal after this price had come into play; and a milder bounce showed up in late-October before sellers were finally able to break below in December. After that December breakdown, 6850 even came back to help with short-term resistance, and that led into the print of fresh two-year lows in the index. With prices now pulling back from those recent lows and the potential for resistance at this prior area of support, the forecast on the FTSE 100 will be set to bearish for next week.
Technical Forecast for the FTSE 100: Bearish
FTSE 100 Daily Price Chart
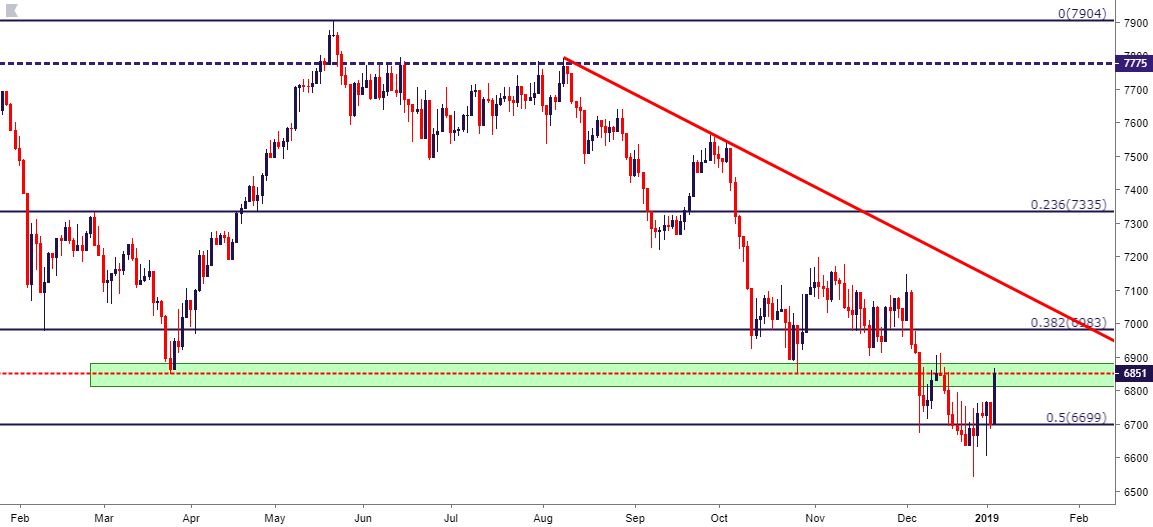
Chart prepared by James Stanley
Nikkei Bounce From Fibonacci Support
Q4 turned out to be a really rough outing for Japanese stocks. The Nikkei came into the new quarter on the heels of a rather aggressive topside breakout, with prices pushing beyond a key level that had helped to hold the highs for the bulk of this summer. That price came in around the 23,000 handle, and this is the 50% marker of the 29-year move in the index, taking the top from December 1989 and drawing that down to the 2008 lows.
The 38.2% retracement of this same study has recently come back into play, helping to set the low last week and holding-up again upon a re-test after the 2019 open. While the momentum here appears attractive for short-side continuation, the potential for this longer-term support level to continue holding the lows muddies the waters and, as such, the forecast will be set to neutral for next week.
Technical Forecast for the Nikkei: Neutral
Nikkei Monthly Price Chart
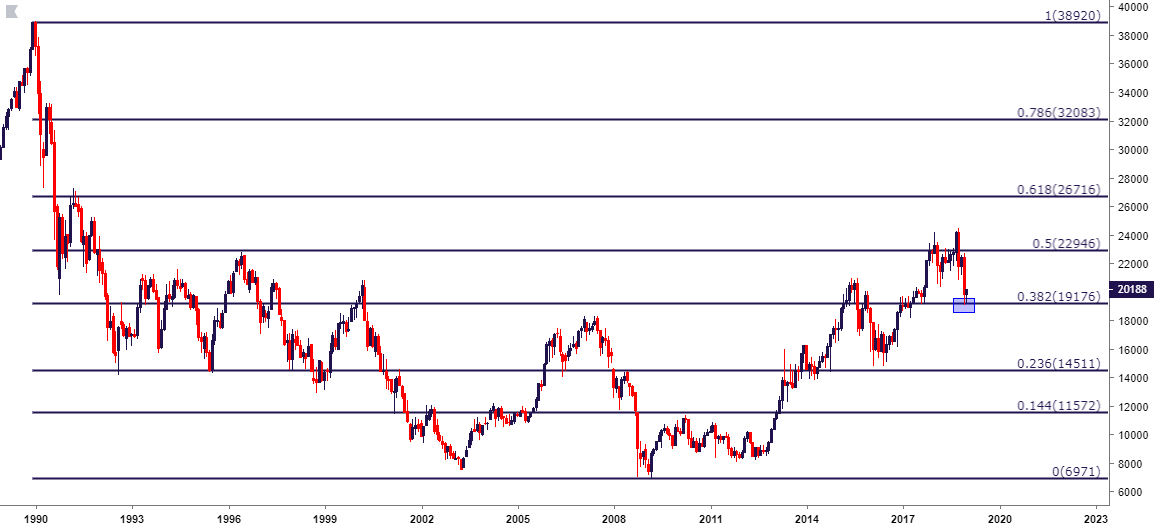
Chart prepared by James Stanley
To read more:
Are you looking for longer-term analysis on the U.S. Dollar? Our DailyFX Forecasts for Q3 have a section for each major currency, and we also offer a plethora of resources on USD-pairs such as EUR/USD, GBP/USD, USD/JPY, AUD/USD. Traders can also stay up with near-term positioning via our IG Client Sentiment Indicator.
Forex Trading Resources
DailyFX offers a plethora of tools, indicators and resources to help traders. For those looking for trading ideas, our IG Client Sentiment shows the positioning of retail traders with actual live trades and positions. Our trading guides bring our DailyFX Quarterly Forecasts and our Top Trading Opportunities; and our real-time news feed has intra-day interactions from the DailyFX team. And if you’re looking for real-time analysis, our DailyFX Webinars offer numerous sessions each week in which you can see how and why we’re looking at what we’re looking at.
If you’re looking for educational information, our New to FX guide is there to help new(er) traders while our Traits of Successful Traders research is built to help sharpen the skill set by focusing on risk and trade management.
--- Written by James Stanley, Strategist for DailyFX.com
Contact and follow James on Twitter: @JStanleyFX
Other Weekly Technical Forecasts:
Australian Dollar Forecast: AUD/USD, AUD/CAD & EUR/AUD Prices Eye Technical Reversal Patterns
British Pound Forecast:20-Month Spike Low May Be Re-Tested
US Dollar Forecast: Dollar Preparing to Break from its Most Restrictive Range In Four Years


