


EUR/USD, US Dollar Talking Points:
- US Dollar weakness carried over into the 2019 open, with price action soon making a move down to re-test the November swing-low around 95.67. But since then, prices in the Greenback have been ripping-higher, re-scaling above the key Fibonacci level at 96.47 in the process.
- The 2019 open brings a plethora of interesting themes across the FX-space, with major questions hanging over the US Dollar, Euro and Japanese Yen. Around the US Dollar of recent, the lack of direction in EUR/USD has produced a backdrop with attractive themes of USD-weakness against the Japanese Yen along with USD-strength through AUD/USD. Those themes remain of interest after the 2019 open, with both pairs putting in moves of weakness down to fresh lows.
- DailyFX Forecasts on a variety of currencies such as the US Dollar or the Euro are available from the DailyFX Trading Guides page. If you’re looking to improve your trading approach, check out Traits of Successful Traders. And if you’re looking for an introductory primer to the Forex market, check out our New to FX Guide.
Do you want to see how retail traders are currently trading the US Dollar? Check out our IG Client Sentiment Indicator.
US Dollar Starts the Year With a Bounce from the November Low
US Dollar weakness carried over into the 2019 open with prices in DXY moving down for a test of the November low. That level comes in at 95.68 and after being re-tested in low-liquidity conditions yesterday, price action posed a quick bounce that continues into this morning. Prices in the US Dollar are now testing above the Fibonacci level at 96.47 level, which is the 23.6% Fibonacci retracement of the 2011-2017 major move.
US Dollar Four-Hour Price Chart
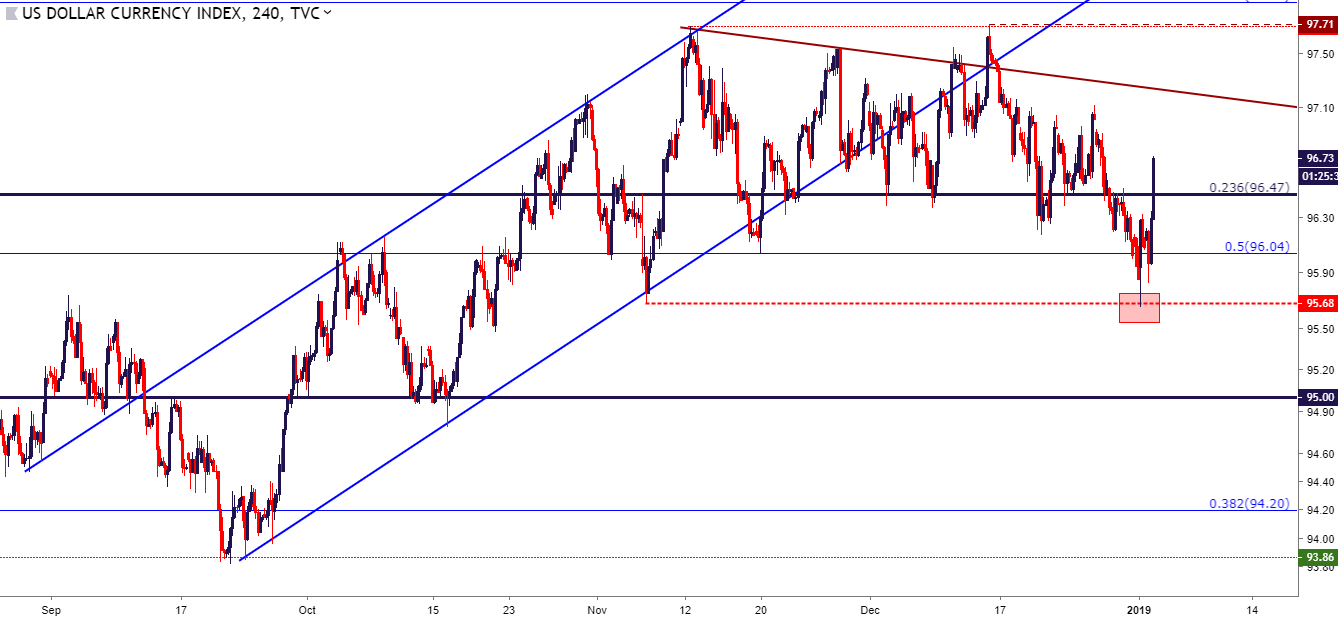
Chart prepared by James Stanley
After a year of 2018 that saw the Greenback recover a portion of its 2017 losses, focus is squarely on the Federal Reserve and whether the bank can continue with their gradual rate hikes into the New Year. This had become a point of contention in Q4, after Jerome Powell said in the opening days of the fresh quarter that the Fed was ‘a long way off’ from the neutral rate. This provided a near-immediate show of pressure in US stocks, and DXY put in a phase of weakness that lasted for about two weeks, until buyers showed up to offer support around the 95.00 handle on the charts. Price action in the USD continued within the bullish channel until December rolled around; and after grinding below the channel in the first portion of the month, sellers started to make way after the December FOMC rate hike.
The big question around the Greenback for 2019 is which trend takes over? Will the 2017 bearish theme come back as focus moves towards a Europe that just announced the end of bond purchases via QE? Or, will the 2018 theme of general strength continue as the Fed remains one of the only games in town for possible rate hikes out of major Central Banks?
In the Q1, 2019 Technical forecast for the US Dollar, I’m looking for the currency to move-lower during the period.
US Dollar Daily Price Chart
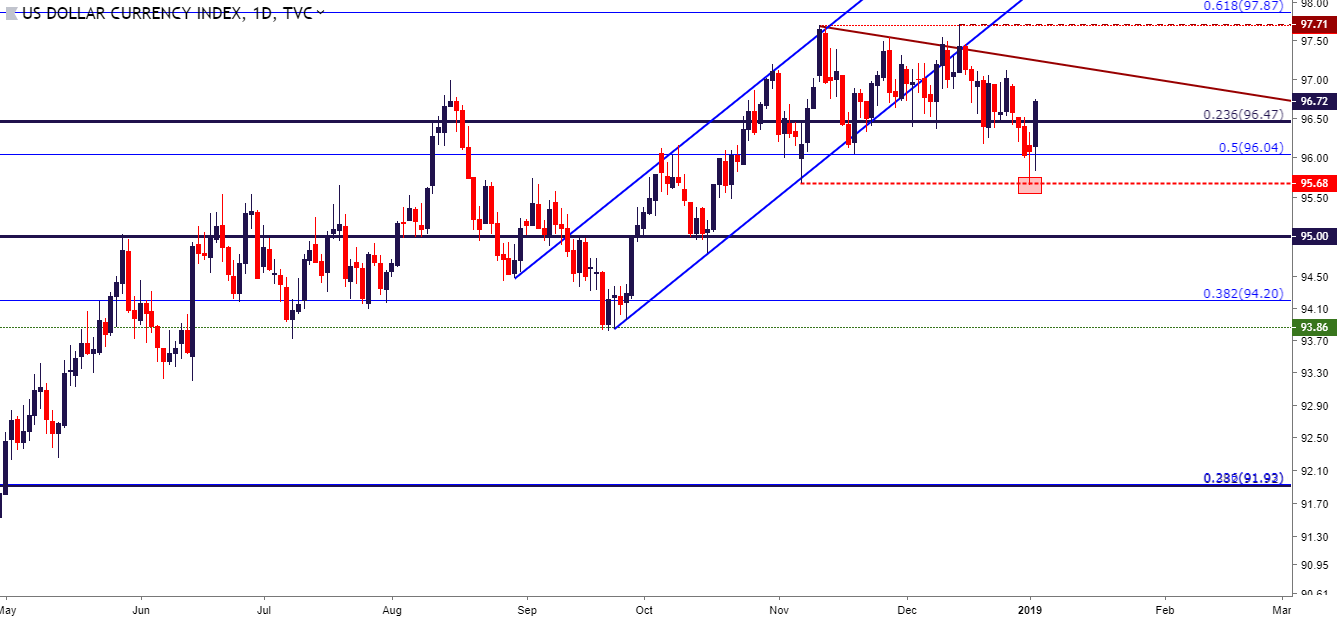
Chart prepared by James Stanley
EUR/USD Starts the Year with a Resistance Test
EUR/USD spent most of Q4 sloshing around within a range that shows support just above the 1.1200 handle and resistance in a key zone that runs from 1.1448-1.1500. The 1.1448 level is the 50% marker of the 2017-2018 bullish trend, and the 1.1500 level is a psychological whole number that helped to set the November swing-high. Collectively, that resistance zone has been in-play for the last few months after first helping to set support in the first-half of October, and soon becoming resistance that remains in-play today.
EUR/USD Daily Price Chart
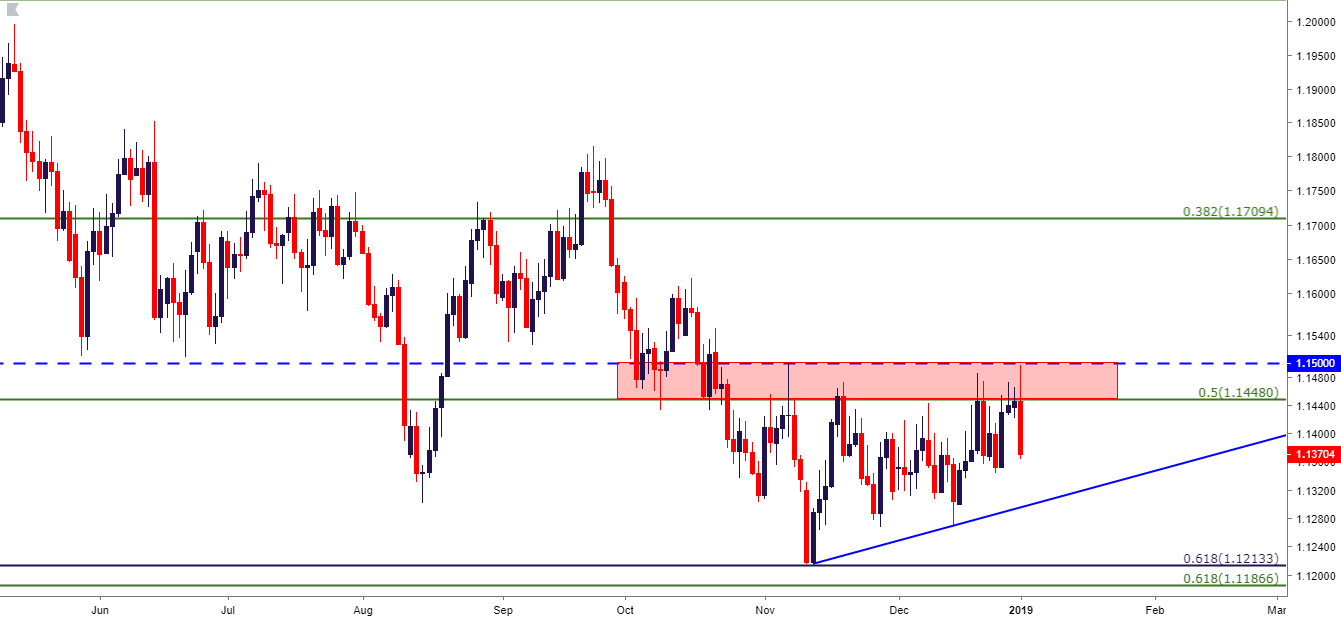
Chart prepared by James Stanley
The big question around the single currency is whether a spate of strength can develop as a couple of major issues have been recently encountered in the Euro-Zone. The debt standoff between Italy and the European Commission that was a source behind much of the currency’s pain in 2018 is over; with the EC accepting Italy’s most recent budget draft. And on the monetary front, the European Central Bank finally announced an end to bond buys as part of their QE program, and the prospect of this event was the prior source of strength as the currency was running-higher in 2017.
With Italy and the EC no longer of chief concern, along with the ECB moving away from bond buys as part of their QE – combined with the fact that the Fed is expected to be more dovish after the ramp in volatility in Q4 – and this could produce a backdrop of strength in the Euro as markets move deeper into 2019.
EUR/USD Weekly Price Chart

Chart prepared by James Stanley
Yen-Strength Continues as USD/JPY Drops to 109.00
Going along with that increase in risk aversion in December has been a re-emergence of Yen-strength . I started looking at the short-side of the pair for strategies behind USD-weakness ahead of last month’s FOMC rate decision; and in short-order the pair dropped through the first two targets, finding a bit of support at the 110.00 level. But even that bounce could not hold, and sellers remained in-control through the final days of 2018 and through the 2019 open.
With the pair now oversold, the big question is whether a retracement develops that could allow for short-side re-entry. The prior zone of support potential that was looked at last week, running from the Fibonacci level of 109.66 up to the 110.00 psychological level, could be interesting for lower-high resistance.
USD/JPY Daily Price Chart

Chart prepared by James Stanley
AUD/USD Starts 2019 with a Test Below .7000
On the long side of the US Dollar, I’ve been following AUD/USD as the pair put in an impressive run of weakness in December. This came after a bullish theme had developed in November, largely on the basis of recovery after a brutal nine-month stretch that saw the pair sell-off in a consistent fashion from January into October. But, as looked at in October, sellers started to get shy around the .7000 big figure; and once some USD-weakness showed up in early-November, AUD/USD was ready to fly-higher on the charts. That theme of strength lasted into the first few days of December, at which point bears re-gained control and have been pushing-lower ever since.
AUD/USD Daily Price Chart: Sellers Re-Grab Control in December

Chart prepared by James Stanley
At this point, the big question is whether sellers can continue to push below the .7000 big figure, or whether a retracement is in order before bearish strategies can become attractive again. RSI has already begun to show a case of divergence on the Daily chart, indicating that the move may already be a bit stretched.
This opens up the possibility of using prior areas of resistance for bearish continuation strategies. The area that I was previously following runs from .7125-.7149, and this could remain as attractive. But, also of interest would be the shorter-term area around .7075, as this prior area of support helped to hold the highs through last week.
AUD/USD Four-Hour Price Chart
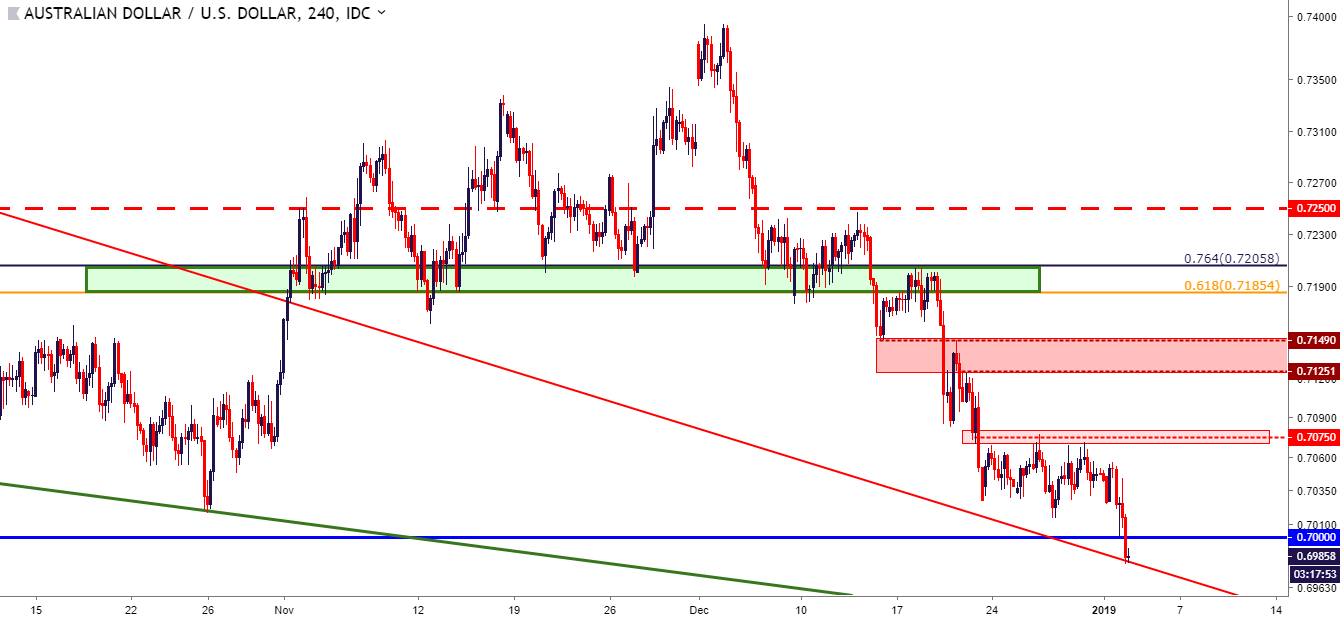
Chart prepared by James Stanley
To read more:
Are you looking for longer-term analysis on the U.S. Dollar? Our DailyFX Forecasts for Q4 have a section for each major currency, and we also offer a plethora of resources on USD-pairs such as EUR/USD, GBP/USD, USD/JPY, AUD/USD. Traders can also stay up with near-term positioning via our IG Client Sentiment Indicator.
Forex Trading Resources
DailyFX offers a plethora of tools, indicators and resources to help traders. For those looking for trading ideas, our IG Client Sentiment shows the positioning of retail traders with actual live trades and positions. Our trading guides bring our DailyFX Quarterly Forecasts and our Top Trading Opportunities; and our real-time news feed has intra-day interactions from the DailyFX team. And if you’re looking for real-time analysis, our DailyFX Webinars offer numerous sessions each week in which you can see how and why we’re looking at what we’re looking at.
If you’re looking for educational information, our New to FX guide is there to help new(er) traders while our Traits of Successful Traders research is built to help sharpen the skill set by focusing on risk and trade management.
--- Written by James Stanley, Strategist for DailyFX.com
Contact and follow James on Twitter: @JStanleyFX


