


FX Setups for the Week of December 24, 2018
- DailyFX Quarterly Forecasts have been updated for Q4, and are available directly from the following link: DailyFX Trading Guides, Q4 Forecasts.
- For trading ideas, please check out our Trading Guides. And if you’re looking for something more interactive in nature, please check out our DailyFX Live webinars.
- If you’d like more color around any of the setups below, join in our live DailyFX webinars each week, set for Tuesday and Thursday at 1PM Eastern Time. You can sign up for each of those sessions from the below link. Note for the holidays - only sessions on Thursday, December 27th and Thursday, January 3rd will be hosted.
Tuesday: Tuesday, 1PM ET
Thursday: Thursday 1PM ET
Do you want to see how retail traders are currently trading the US Dollar? Check out our IG Client Sentiment Indicator.
Low-Liquidity Potential Around Upcoming Holiday Period
It’s been a fast and furious month of December and, at this point, there’s no sign yet of that letting up. US stocks are diving down for a re-test of the lows, EUR/USD is putting in a very noticeable drop from a key resistance zone after testing fresh four month highs and USD/CAD continues to scream-higher on the charts, going into a near-parabolic like bullish state as buyers push fresh 18-month highs in the pair.
But next week brings an item-of-change into the equation, and I discussed this as well as how to adapt in yesterday’s webinar: Tuesday is Christmas, and the Tuesday after is New Years. This means that next week will likely be punctuated by low liquidity conditions across global markets and given the scope of some of the headline themes of recent, this could produce a difficult environment for short-term strategies. As such and as I noted in yesterday’s webinar, this is an environment in which I don’t want to look at much on a short-term basis. Swing setups can remain as attractive, however, and that’s what’s on my radar for the next week as year-end nears.
A caveat here is required, as next week’s likely display of low liquidity would mean that expectations should be accordingly lowered. The entry filter(s) that I’m looking for on each of the below setups is a bit tighter than usual as I don’t want to chase in a market environment that may create barbed wire on the charts. This would mean that I’d need pullbacks in USD/JPY and AUD/USD to open the door for continuation strategies, while EUR/USD would need to push past fresh two-month highs to begin opening the door for workable setups.
Bearish USD/JPY
I started to line up the short-side of USD/JPY coming into this week, and that setup filled-in fairly quickly as both targets were met in short-order. The quandary now is whether the pair is in an oversold position after this week’s bearish move; but this can keep the market as attractive provided that a pullback comes into play.
The first target on last week’s setup was at 112.30, which is around the 76.4% Fibonacci retracement of the November 2017 – March 2018 major move. This is a level that had already been tested twice in early-December, and this level even caught a bit of support ahead of the FOMC rate decision on Wednesday. But, as risk aversion continued to price through markets, that support could hold for no more as sellers pushed lower, and that bearish trend ran all the way down to the next Fibonacci level of that study, taken from the 61.8% retracement at 110.86.
This opens the door for lower-high resistance to post around that area of prior Fibonacci support. That level is at 112.34, but the zone can be drawn around this area to include the range from 112.20 up to 112.50. The next area of support underneath price action is around the 50% marker of that same major move, in a zone drawn up to the psychological level of 110.00.
USD/JPY Daily Price Chart

Chart prepared by James Stanley
Bearish AUD/USD
On the long side of the US Dollar, I started to look at AUD/USD coming into this week. After a rather strong month of November, the pair put in an aggressive sell-off in early-December that pushed prices down to a big zone of support. As looked at in last Thursday’s webinar, that support bounce had built into a bear flag formation, and in this week’s FX Setups of the Week, I looked for that theme to continue down to fresh monthly lows in the pair.
That’s largely played out, and AUD/USD is well-below the .7100 handle and making a fast approach at the 2018 low. This does bring on a bit of a challenge to short-side continuation approaches, however, and the pair may need a decent pullback before bearish strategies can become attractive again. This can be looked for in an area of potential resistance taken from prior support; and a response from sellers to show resistance at this zone can re-open the door for short-side strategies in the pair. This zone is set up for the area between .7122-.7150, as this would allow for risk levels atop the .7206 Fibonacci level.
AUD/USD Eight-Hour Price Chart
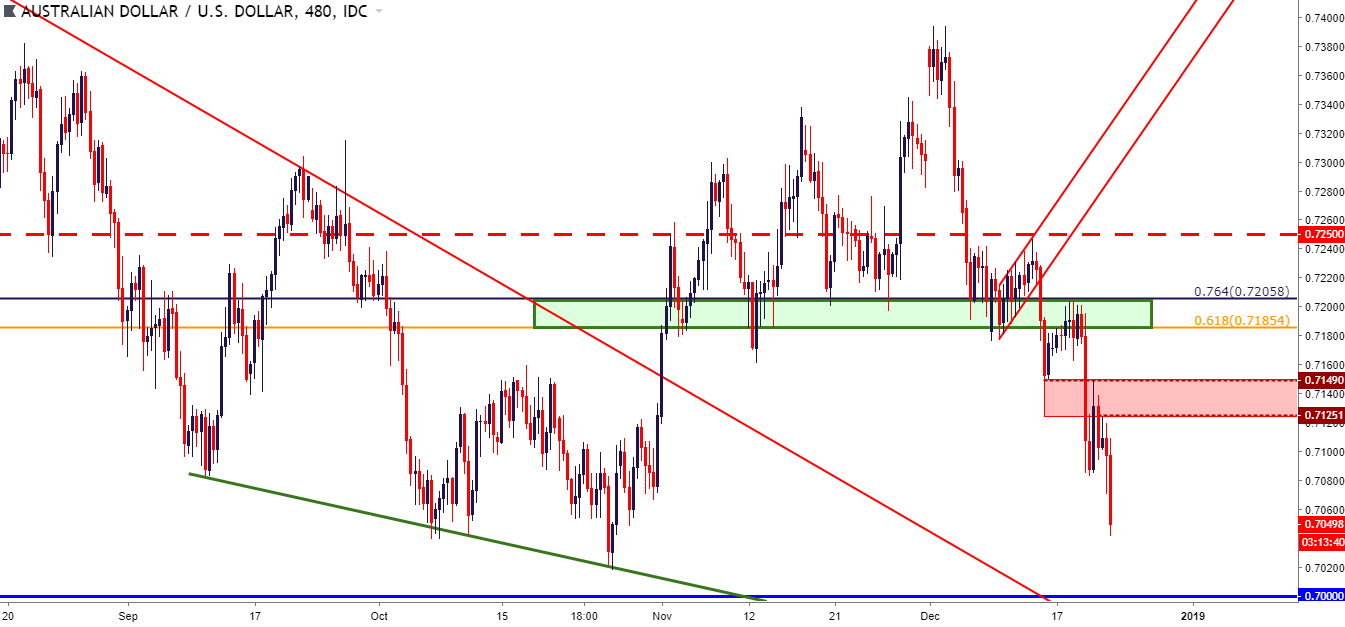
Chart prepared by James Stanley
Bullish EUR/USD on Break and Build Above Key Resistance
It’s been an interesting week in the Euro, with some of the more positive headlines perhaps obscured by other matters like the FOMC rate decision. Just ahead of that announcement, a détente was reached in the Italian budget saga as the EU accepted the most recent budget proposal. This was a major hurdle for the single currency all year, with a bearish trend showing up in EUR/USD as a Euro-skeptic coalition was elected to power in Italy this April; and then again in late-September/early-October as the newly installed government neared a budget clash with Brussels.
That tension remained all the way into this week; and last week’s announcement from the ECB that bond buying in the QE program would end this month brings another factor of optimism to the table for Euro bulls.
Last week , I had looked at the bigger-picture range in the pair, focusing on support from 1.1187-1.1212 and resistance from 1.1448-1.1500. I wanted to see that impasse first break before assigning directional strategies to the pair, and last week’s focus was on support for strategies of USD-strength. But now that USD-weakness has showed up, and a couple of positive items have perked up around the Euro-zone, bullish themes may soon be nearing as prices in EUR/USD pushed up to fresh monthly highs earlier this morning.
For this setup, I first want to see prices break-out of the 1.1500 psychological level, which had helped to set the November swing high; and after this takes place, I can begin plotting for higher-low support. Any evidence of higher-low support after that fact opens the door for topside setups in the pair, targeting the 1.1600 swing high followed by the 1.1709 Fibonacci level.
Until then, caution is the order of the day on EUR/USD as the pair trades within the two-month range.
EUR/USD Eight-Hour Price Chart: Year-End Rally Potential Upon Break of 1.1500

Chart prepared by James Stanley
To read more:
Are you looking for longer-term analysis on the U.S. Dollar? Our DailyFX Forecasts for Q4 have a section for each major currency, and we also offer a plethora of resources on USD-pairs such as EUR/USD, GBP/USD, USD/JPY, AUD/USD. Traders can also stay up with near-term positioning via our IG Client Sentiment Indicator.
Forex Trading Resources
DailyFX offers a plethora of tools, indicators and resources to help traders. For those looking for trading ideas, our IG Client Sentiment shows the positioning of retail traders with actual live trades and positions. Our trading guides bring our DailyFX Quarterly Forecasts and our Top Trading Opportunities; and our real-time news feed has intra-day interactions from the DailyFX team. And if you’re looking for real-time analysis, our DailyFX Webinars offer numerous sessions each week in which you can see how and why we’re looking at what we’re looking at.
If you’re looking for educational information, our New to FX guide is there to help new(er) traders while our Traits of Successful Traders research is built to help sharpen the skill set by focusing on risk and trade management.
--- Written by James Stanley, Strategist for DailyFX.com
Contact and follow James on Twitter: @JStanleyFX


