


EUR/USD, US Dollar Talking Points:
- Next week brings the Christmas holiday and the week after brings New Years. This means that next week’s trade will likely be governed by low-liquidity conditions and given the volatile nature of some of the items in the headlines, this could be an especially dangerous time to hold weekend or overnight risk. Next week’s economic calendar is relatively light, with a couple of items of interest in the latter-portion of the week.
- US equities have continued to sell-off after the FOMC rate hike on Wednesday of this week, and the S&P 500 is testing below a key level around 2487, which is the 50% marker of the post-Election move in the index. In the FX-space, risk aversion has continued to price through the Japanese Yen, with USD/JPY catching support at a key Fibonacci level at 110.86. Should risk aversion continue, the door may be open to a deeper drop with a test of the 110.00 psychological level.
- DailyFX Forecasts on a variety of currencies such as the US Dollar or the Euro are available from the DailyFX Trading Guides page. If you’re looking to improve your trading approach, check out Traits of Successful Traders. And if you’re looking for an introductory primer to the Forex market, check out our New to FX Guide.
Do you want to see how retail traders are currently trading the US Dollar? Check out our IG Client Sentiment Indicator.
US Dollar Bounces from Monthly Lows as Post-FOMC Equity Sell-Off Continues
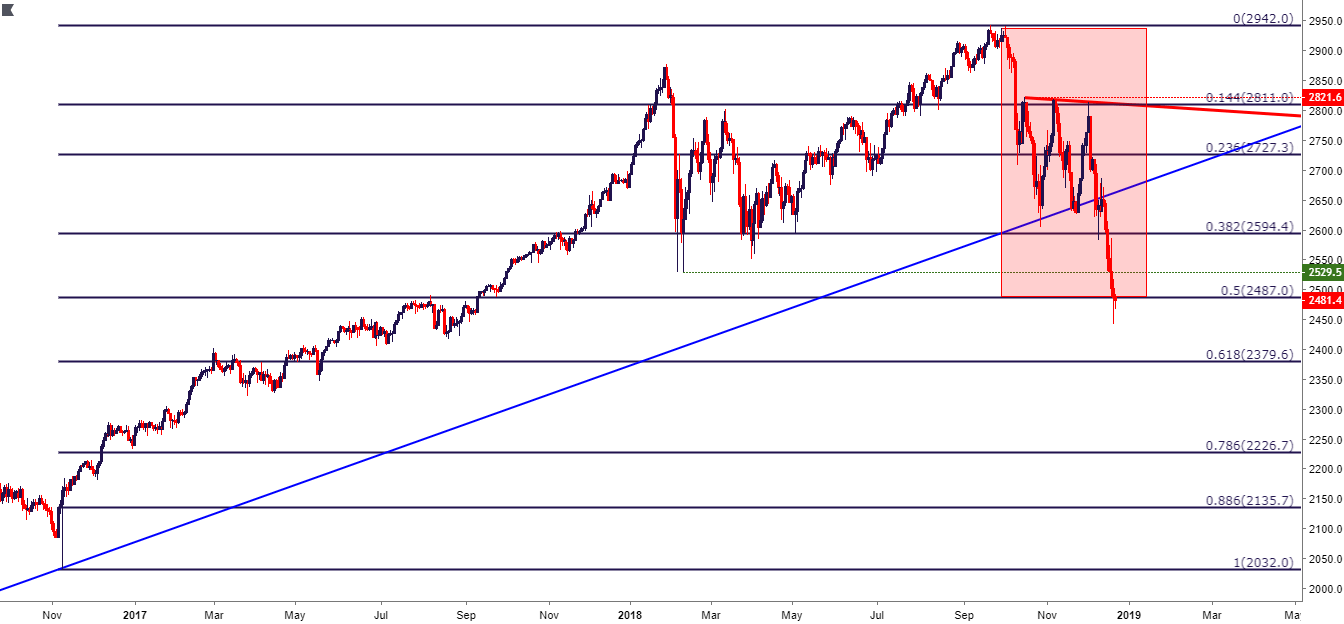
The US Dollar is catching a bounce after setting a fresh monthly low yesterday, and this could be a bit of a reprieve for USD bulls ahead of the holidays. Next week brings Christmas on Tuesday, and the week after brings New Years. This means that next week will likely be punctuated by low-liquidity across Western markets, and this can bring on an especially dangerous environment given the volatile nature of some of the themes currently in the headlines. US stocks continued their descent yesterday, and a key area on the S&P 500 chart appears to be trying to help cauterize the lows. This comes in at the 50% marker of the post-election move in the index, taken from the overnight low on the night of the US Presidential election in 2016 up to the high that was set around the Q4 open.
S&P 500 Daily Price Chart: Support Potential Around 50% of the Post-Election Move
Light Economic Calendar Ahead
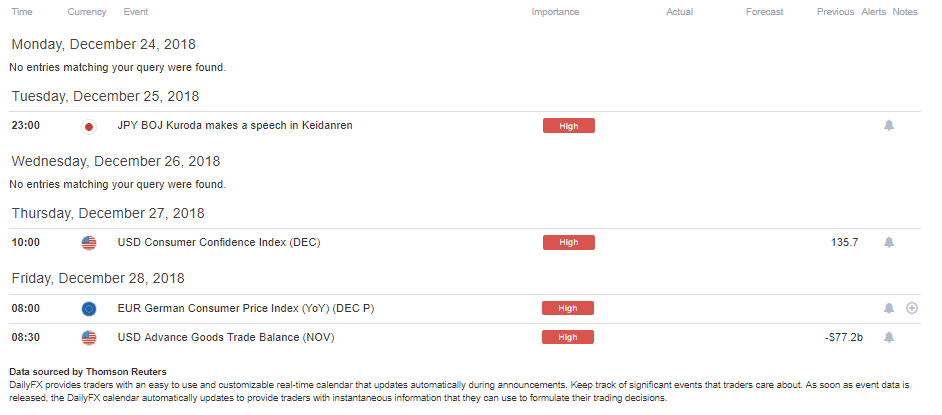
Given the holiday next week, the economic calendar is especially light. Comments from BoJ Governor Kuroda come out on Tuesday night, and Thursday brings Consumer Confidence numbers out of the US. European inflation numbers are due on Friday morning and this is followed shortly-after by the release of US Trade balance figures. Of the group, it would appear that the release of preliminary inflation data out of Europe would be the high-point; as the ECB has recently announced an end to bond buying via the bank’s QE program; and any signs of strength in inflation could be met with a bullish response in the single currency.
DailyFX Economic Calendar: High-Impact Events for the Week of December 24, 2018
EUR/USD Softens From Key Resistance Zone
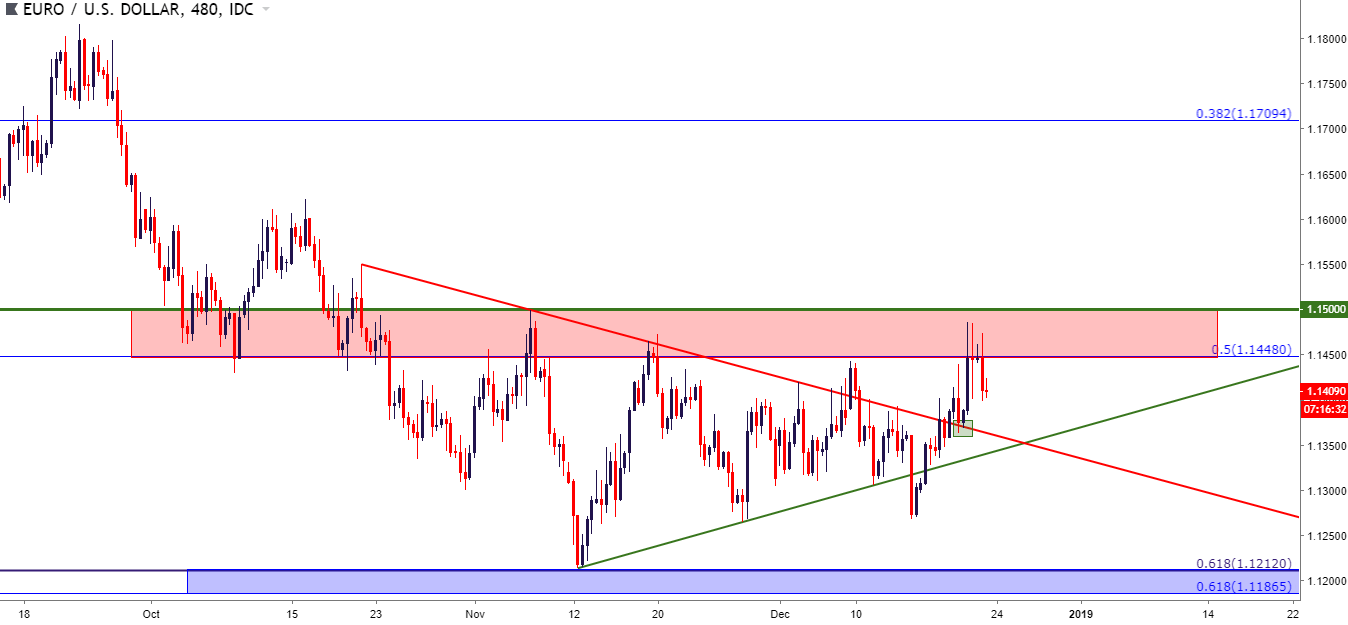
Yesterday’s session saw EUR/USD move-up to its highest level in six weeks, trading into a key zone of resistance that’s been in-play for most of Q4. The area that runs from 1.1448-1.1500 was initially support around the October open; but prices soon slid below and tested that zone for resistance multiple times in the month of November. The price of 1.1448 is the 50% marker of the 2017-2018 bullish run, and the 1.1500 psychological level caps the top-end of the zone while also functioning as the November swing-high. A topside break through this zone would bring on fresh two-month highs going into year-end, and this is a scenario that could soon re-open the door for bullish strategies in the pair.
EUR/USD Eight-Hour Price Chart
GBP/USD: Cable Consolidates Deeper into Symmetrical Triangle
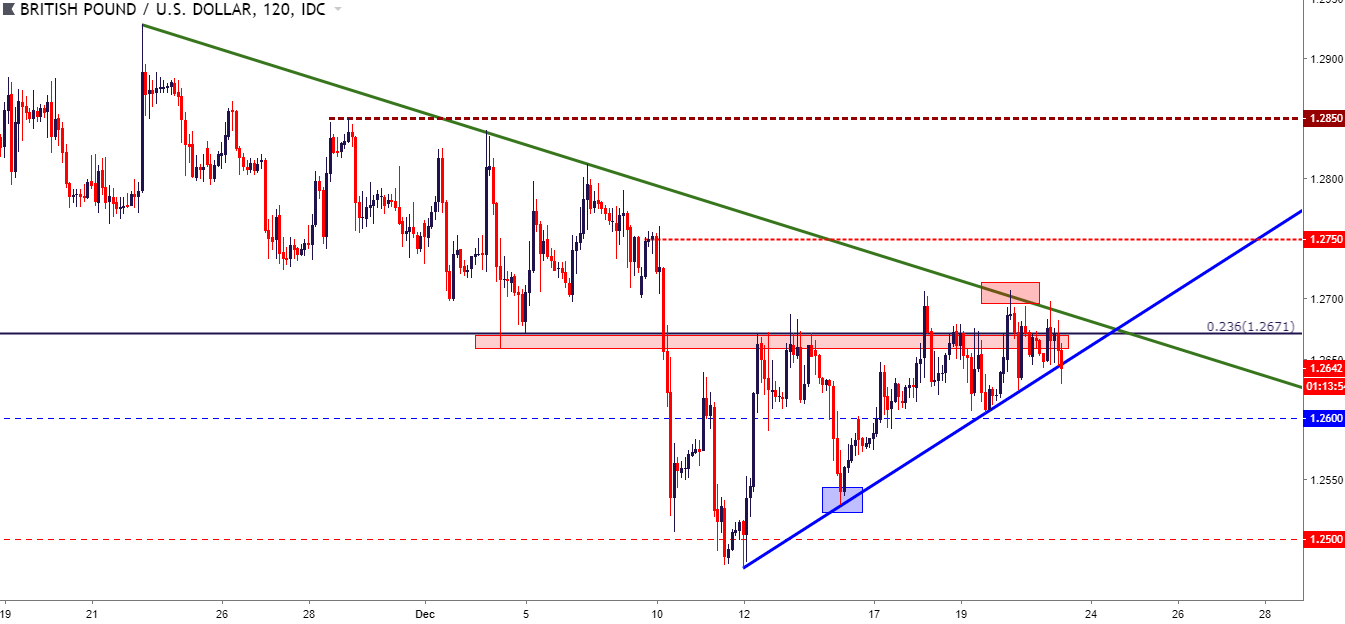
Volatility in GBP/USD is slowing as prices continue to consolidate within the symmetrical triangle formation. As discussed in yesterday’s webinar, this could be a difficult market around the 2019 open as the Brexit vote in Parliament lurks on the calendar for the week of January 14th. The vote will be held on the same Brexit plan that appeared destined to fail just a week ago, so it could be difficult to muster much optimism around that theme. But – as shown via price action, sellers have slowed down after last week’s push down to 1.2500; and continued short-cover going into year-end could compel higher prices on the chart.
The deeper resistance area that I’ve been following is around 1.2750, as this is a psychological level that helped to form a lower-high just ahead of that bearish breakout. If prices break-above 1.2850, that means there is likely a USD-weakness theme at work, and this could invalidate the bearish stance in Cable while also opening up the possibility of a 1.3000 test. But – at that point, the trader would likely need to ask whether there are more attractive areas to trade for USD-weakness; using markets that aren’t hampered by a potentially negative driver that lurks just around the corner of the 2019 open.
GBP/USD Two-Hour Price Chart
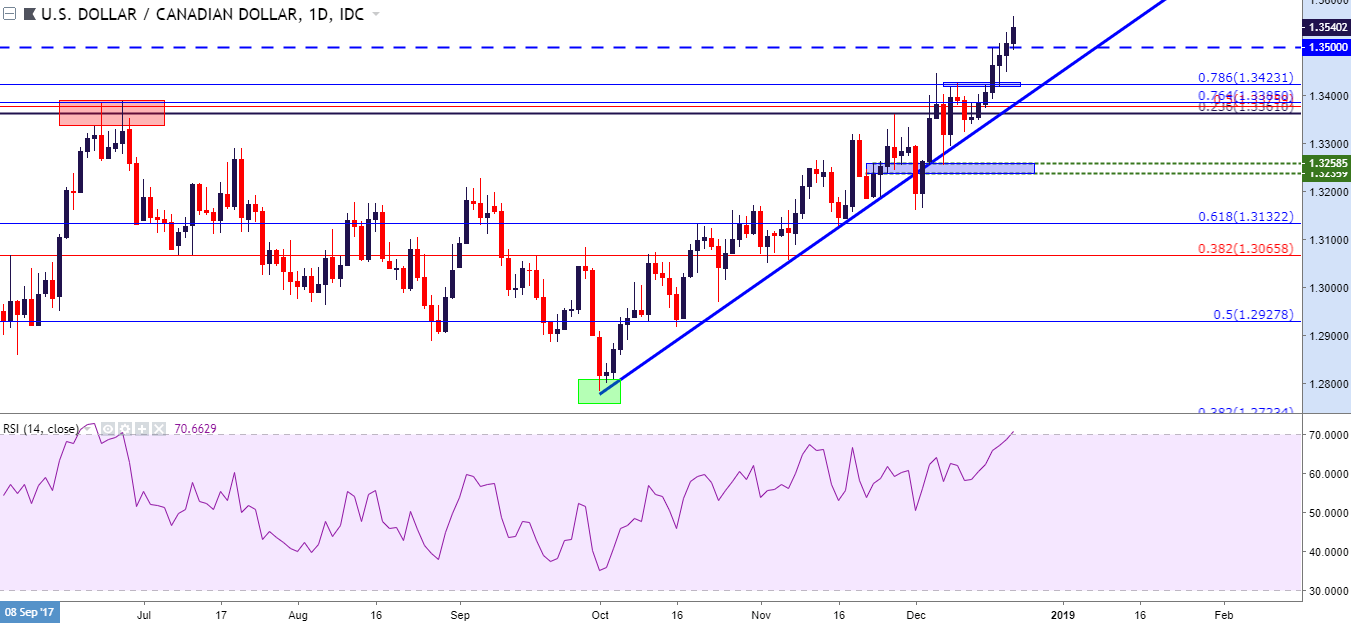
USD/CAD Continues to Charge-Higher Despite USD Pullback
Even though the US Dollar has tumbled for most of the week, USD/CAD has continued to show USD-strength. CAD has been even weaker, helped in part by a continued sell-off in Oil prices, and this has helped to create fresh 18-month highs in the pair, running through a number of resistance levels in the process. At this point, the fear would be chasing an overbought market as RSI on the daily chart has just started to make a move above the 70 level.
As discussed in yesterday’s webinar, a pullback could help matters, and given those areas of prior resistance, there exists multiple spots for potential support. The current area of interest for a pullback appears to be around 1.3423, as this is the 78.6% Fibonacci retracement of the May-September 2017 major move, and this area had helped to hold the highs in the first half of December until this week’s topside breakout.
USD/CAD Daily Price Chart
USD/JPY Finds Support at Key Fibonacci Level: More Pain in Store?
USD/JPY was one of my picks for USD-weakness coming into this week, and the pair put in a noticeable downside break to clear through both targets. The first target was set to a key area of support that had been tested twice already in December, and this is at 112.34 which is the 76.4% Fibonacci retracement of the November 2017 – March 2018 major move.
Price action soundly broke-through that level yesterday, and support didn’t begin to show until prices tested below 111.00, finding a bit of support at the 61.8% retracement of that same major move, which is continuing to help to hold the lows. Below this area is another zone of interest, running from the 50% marker of that same Fibonacci study up to the 110.00 psychological level. If themes of risk aversion hold into next week’s open, this could be an item of interest for short-term support in the pair.
USD/JPY Daily Price Chart
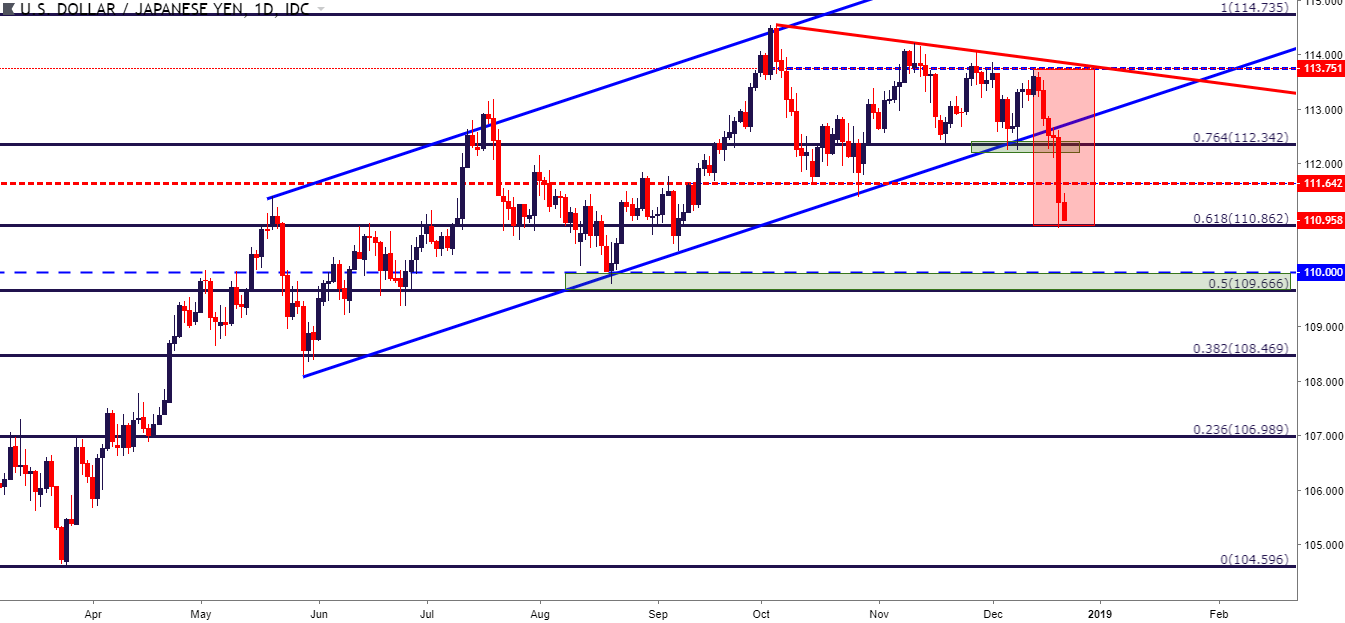
Chart prepared by James Stanley
To read more:
Are you looking for longer-term analysis on the U.S. Dollar? Our DailyFX Forecasts for Q4 have a section for each major currency, and we also offer a plethora of resources on USD-pairs such as EUR/USD, GBP/USD, USD/JPY, AUD/USD. Traders can also stay up with near-term positioning via our IG Client Sentiment Indicator.
Forex Trading Resources
DailyFX offers a plethora of tools, indicators and resources to help traders. For those looking for trading ideas, our IG Client Sentiment shows the positioning of retail traders with actual live trades and positions. Our trading guides bring our DailyFX Quarterly Forecasts and our Top Trading Opportunities; and our real-time news feed has intra-day interactions from the DailyFX team. And if you’re looking for real-time analysis, our DailyFX Webinars offer numerous sessions each week in which you can see how and why we’re looking at what we’re looking at.
If you’re looking for educational information, our New to FX guide is there to help new(er) traders while our Traits of Successful Traders research is built to help sharpen the skill set by focusing on risk and trade management.
--- Written by James Stanley, Strategist for DailyFX.com
Contact and follow James on Twitter: @JStanleyFX


