


US Dollar, EUR/USD Talking Points:
- Yesterday brought the fourth rate hike this year out of the Federal Reserve, and the market response across equities was not positive as the S&P 500 moved down to a fresh 2018 low while the Dow Jones Industrial Average pushed down for a support test at the February swing. Moves in currencies were a bit less-pronounced, as the US Dollar’s initial push of strength was strongly faded-out of markets starting around the open of trade in Asia.
- EUR/USD is trading at six-week-highs after that USD-weakness came online; and the pair is putting in a test at a key resistance zone on the chart that’s been in-play for much of Q4. As discussed yesterday morning and perhaps lost in the shuffle with all of the excitement around the Fed, the détente between the EC and Italy can keep the door open for further Euro strength as a primary risk factor around the currency and economy gets priced-out of the equation. The big level to watch in EUR/USD appears to be around the top-side of that zone at 1.1500.
- DailyFX Forecasts on a variety of currencies such as the US Dollar or the Euro are available from the DailyFX Trading Guides page. If you’re looking to improve your trading approach, check out Traits of Successful Traders. And if you’re looking for an introductory primer to the Forex market, check out our New to FX Guide.
Do you want to see how retail traders are currently trading the US Dollar? Check out our IG Client Sentiment Indicator.
The Morning After the Rate Hike
Yesterday brought the fourth rate hike out of the Fed for this year at the bank’s final meeting of 2018. The initial reaction across equities was not bullish, as prices pushed down to fresh yearly lows in the S&P 500 as the Dow moved down for a support at the February lows. On the part of the US Dollar, the currency put in an initial move of strength around the hike and provided guidance for 2019; finding a bit of resistance around a prior area of support around the 97.00-handle. But, as Asia opened for trade, USD bears came back and continued to push into this morning’s Euro open; helping to set a fresh monthly low in the currency with a drop below the 96.47 Fibonacci level.
US Dollar Four-Hour Price Chart

Chart prepared by James Stanley
EUR/USD Jumps into Resistance Zone
Helping with that emergence of USD-weakness has been strength in the Euro following yesterday’s news of a deal between the EU and Italian government. The détente around the Italian budget removes a primary bearish driver from the pair after the past eight months have been mired with fits and starts of fear around an elongated stand-off between the two parties.
But, as USD-weakness came-online around the open of trading in Asia, EUR/USD was ready to rally and prices soon pushed into the zone of resistance that’s held the highs in the pair since mid-October. Prices in EUR/USD are currently sitting at six-week highs, softening ahead of a test of the 1.1500 handle.
EUR/USD Four-Hour Price Chart
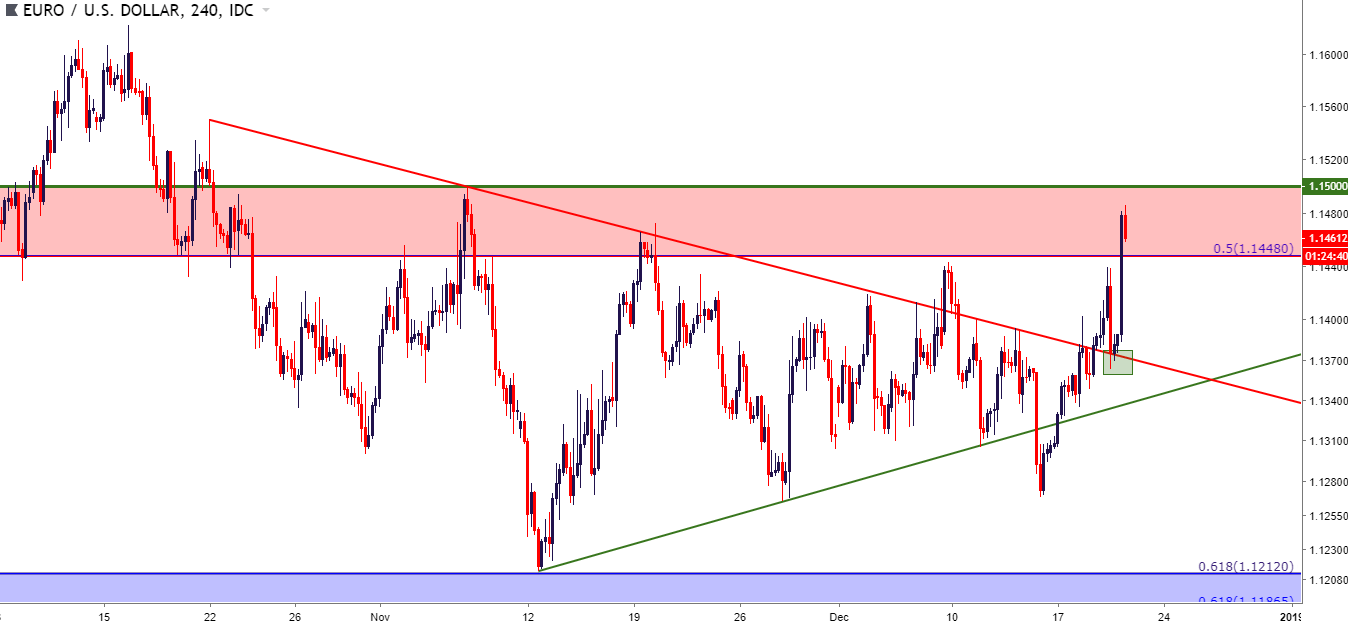
Chart prepared by James Stanley
On a longer-term basis, this can be a difficult area to work with, at least until bulls are able to test above the 1.1500 handle. But, as discussed in Tuesday’s webinar, the backdrop for continued gains in the pair can be there provided that buyers are able to push above this key area on the chart.
EUR/USD Daily Price Chart

Chart prepared by James Stanley
USD/JPY Drops to Next Support After Breach of 112.34 Fibonacci Level
On the side of USD-weakness, I started to look at USD/JPY coming into this week’s trade. The pair had continued to put in lower-highs over the past couple of months, and this opened the door for a revisit to the Fibonacci level at 112.34. I had listed a second target at a deeper support level around 111.63, which is currently helping to set the low for the day.
This can keep the door open for further losses in the pair. Deeper support potential exists around the Fibonacci level at 110.86 followed by the psychological level of 110.00.
USD/JPY Eight-Hour Price Chart: Drops to Deeper Support as USD-Weakness Takes Hold

Chart prepared by James Stanley
GBP/USD Tests Trend-Line Resistance
This morning brought a Bank of England rate decision to the fray, and the bank voted 9-0 to keep rates flat. The BoE did note that Brexit uncertainty has ‘intensified considerably’ and that lower oil prices can push inflation below the 2% marker. This brought a bit of weakness to the pair after prices pushed up to test trend-line resistance, as taken from swing-highs over the past month . Deeper resistance potential remains around that 1.2750 psychological level; and if price action does pose a top-side break above 1.2850, there may be bullish setups to soon investigate in the pair.
GBP/USD Four-Hour Price Chart
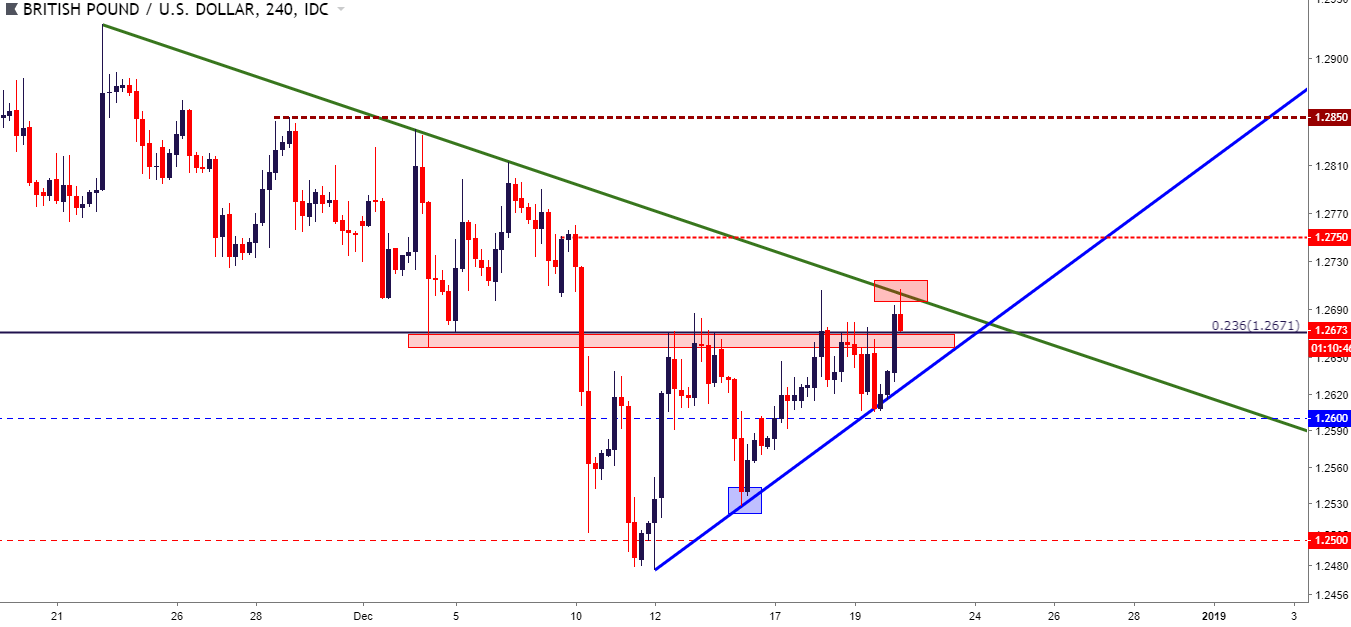
Chart prepared by James Stanley
AUD/USD Pulls Back Following Bearish Breakout on the Fed
On the long side of the US Dollar, I started to follow AUD/USD last week as prices built into a bear flag formation. This indicated potential reversal of the November strength in the pair; and after another bear flag built with resistance showing at a key zone, the door was re-opened for short-side setups, as discussed in this week’s FX Setups of the Week.
The initial rush of USD-strength around FOMC helped to elicit a downside break in the pair, and AUD/USD soon moved down to test-below .7100. And even with the re-emergence of USD-weakness, which is helping pairs like EUR/USD and GBP/USD test fresh highs, AUD/USD has the potential for the continued build of lower-high resistance. The zone that runs from .7149-.7161 is of interest, as each of these prices helped to set recent swing-lows in the pair. A hold of resistance here keeps the door open for short-side setups with risk levels set above this week’s high, around the 76.4% retracement of the 2008-2011 major move residing at .7206.
AUD/USD Four-Hour Price Chart
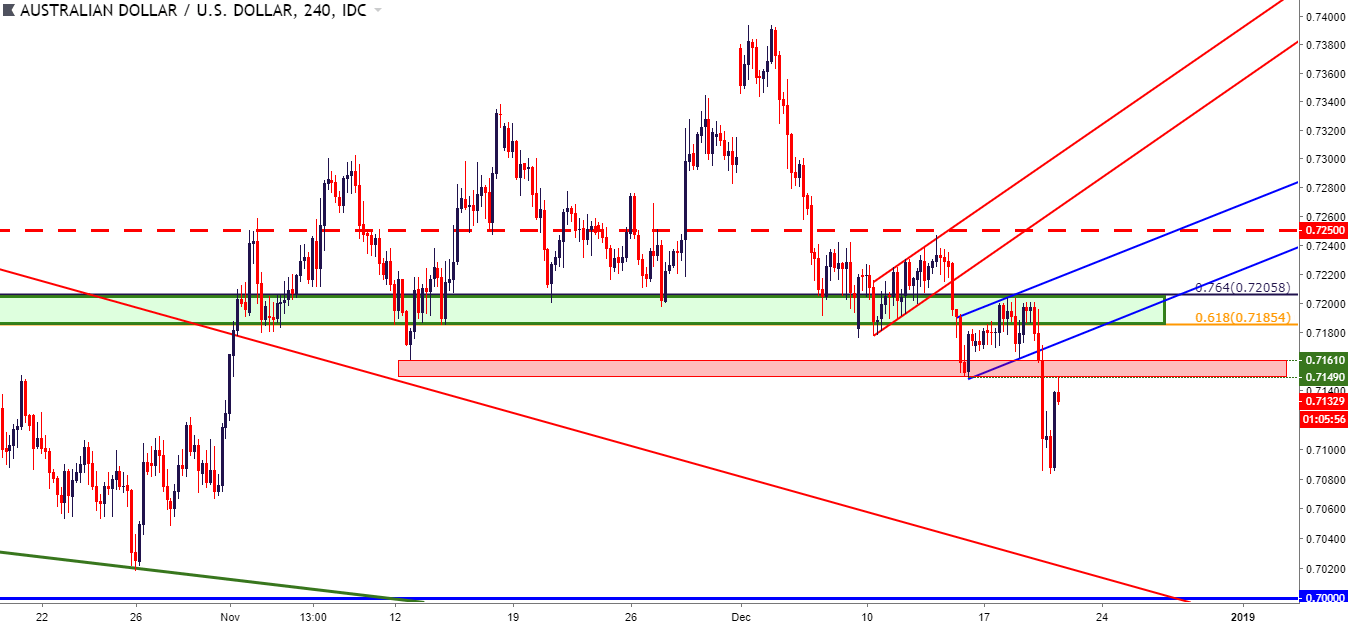
Chart prepared by James Stanley
To read more:
Are you looking for longer-term analysis on the U.S. Dollar? Our DailyFX Forecasts for Q4 have a section for each major currency, and we also offer a plethora of resources on USD-pairs such as EUR/USD, GBP/USD, USD/JPY, AUD/USD. Traders can also stay up with near-term positioning via our IG Client Sentiment Indicator.
Forex Trading Resources
DailyFX offers a plethora of tools, indicators and resources to help traders. For those looking for trading ideas, our IG Client Sentiment shows the positioning of retail traders with actual live trades and positions. Our trading guides bring our DailyFX Quarterly Forecasts and our Top Trading Opportunities; and our real-time news feed has intra-day interactions from the DailyFX team. And if you’re looking for real-time analysis, our DailyFX Webinars offer numerous sessions each week in which you can see how and why we’re looking at what we’re looking at.
If you’re looking for educational information, our New to FX guide is there to help new(er) traders while our Traits of Successful Traders research is built to help sharpen the skill set by focusing on risk and trade management.
--- Written by James Stanley, Strategist for DailyFX.com
Contact and follow James on Twitter: @JStanleyFX


