


Talking Points:
- The US data trove for this week has gotten underway, as we’ve already seen the release of Durable Goods numbers for January along with opening remarks from Mr. Jerome Powell’s first Semiannual Monetary Report to Congress. The day is not done yet, as Consumer Confidence numbers are to be released at 10 AM ET while Mr. Powell begins his testimony in-front of the House Financial Services Committee. Thursday sees that testimony continue when Mr. Powell speaks in-front of the Senate Banking Committee.
- The US Dollar caught a bid after the US opened for the day and ahead of this morning’s drivers, with a push above 90.00 shortly after those opening remarks were released. Prices in DXY have gotten quite volatile as another test of that key psychological level is underway. Below, we look at the Dollar in a series of major pairs: EUR/USD, GBP/USD, AUD/USD and USD/CHF.
- Are you looking to improve your trading approach? Check out Traits of Successful Traders. And if you’re looking for an introductory primer to the Forex market, check out our New to FX Guide.
If you’re looking for longer-term analysis on US Stocks, the Euro or the U.S. Dollar, click here for our Trading Guides.
US Dollar Shake and Bake
This week’s data outlay out of the US got underway this morning with the release of Durable Goods numbers from the month of January, along with Advanced Trade Balance figures. Also released at 8:30 AM ET were opening remarks for Mr. Jerome Powell’s upcoming Humphrey Hawkins testimony. Later on the morning, starting at 10 AM, Mr. Powell will begin speaking in front of the House Financial Services Committee. And also at 10 AM, we’ll get the release of consumer confidence numbers out of the US for last month. The Semiannual Monetary Report to Congress will continue on Thursday morning, as Mr. Powell speaks in front of the Senate banking committee.
So – there are quite a few USD drivers on the horizon, on top of the ones that have just been delivered. Interestingly, the Dollar got to moving before any of this morning’s data was released. The time of 8:30 was particularly pensive as we were getting two high impact data prints along with those opening remarks from Mr. Powell. Despite this, the Dollar started to gain shortly after 8 AM as the US was coming online for the day.
US Dollar via ‘DXY’ One-Minute Chart: Strength Starts at US Open (8 AM ET)
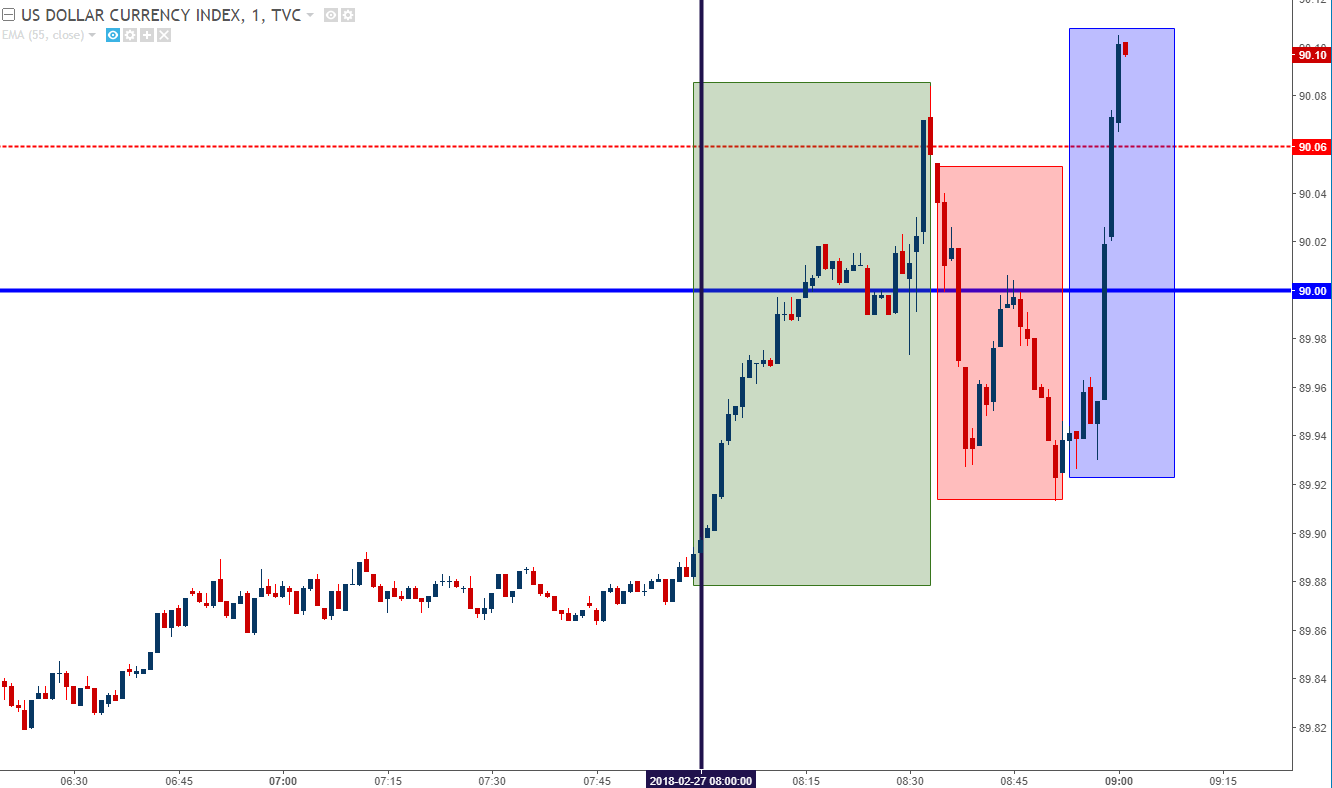
Chart prepared by James Stanley
This run in the Greenback took-out that Friday high of 90.06, albeit temporarily as prices quickly moved back-below the 90.00 level for a check of support. Strength came back around 30 minutes after those data releases, making for a volatile short-term situation in USD. Taking a step back in the effort of perspective, a bullish break above last week’s swing-high of 90.24 keeps the door open for bullish strategies in the US Dollar, targeting prior levels of resistance at 90.57 and 91.00.
US Dollar via ‘DXY’ Four-Hour Chart: Threatening to Break the Bearish Intermediate-Term Trend
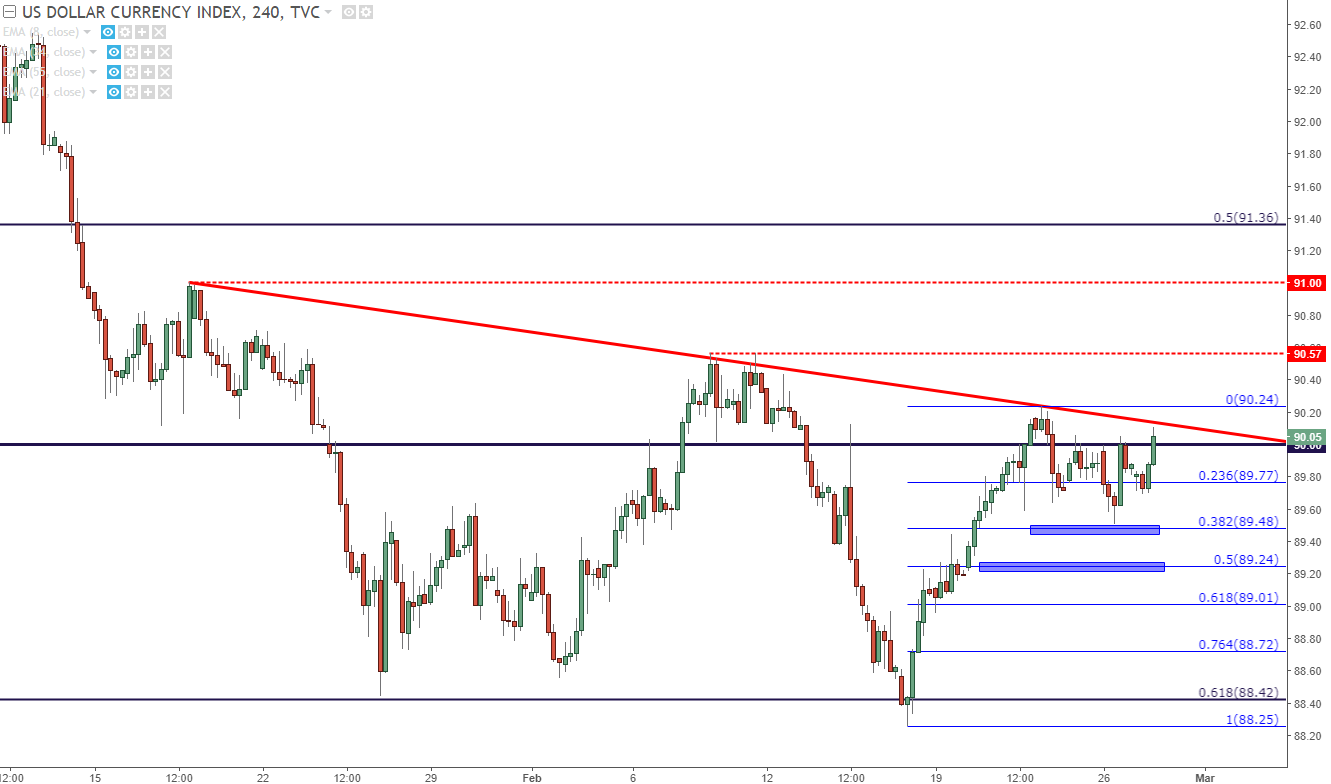
Chart prepared by James Stanley
EUR/USD Round-Trip From Resistance to Support
While EUR/USD remains relatively quiet on a short-term basis, particularly in-light of the earlier month volatility, the pair has largely been sticking with pre-defined support and resistance levels. Before the US opened for the day, EUR/USD was continuing to find resistance in that same zone that we looked at yesterday. As that quick run of Dollar-strength showed-up, EUR/USD moved-down to test support around 1.2281.
At this stage, traders would likely want to proceed with a great deal of caution here, as a waning bullish response to iterative support tests indicates that a deeper bearish move may be on the horizon.
EUR/USD Hourly Chart: Oscillation Within Range Continues

Chart prepared by James Stanley
GBP/USD Messy Near-Term, Longer-Term Trend Remains
While EUR/USD has been relatively clean on a shorter-term basis, Cable has been a bit more chaotic. This can keep interesting around short-side USD-continuation, particularly if a longer-term zone of support comes into play over the next few days. We published a technical article on the pair yesterday, focusing on potential support in a zone that runs from the February low of 1.3765 up to the Fibonacci level at 1.3837.
GBP/USD Daily Chart
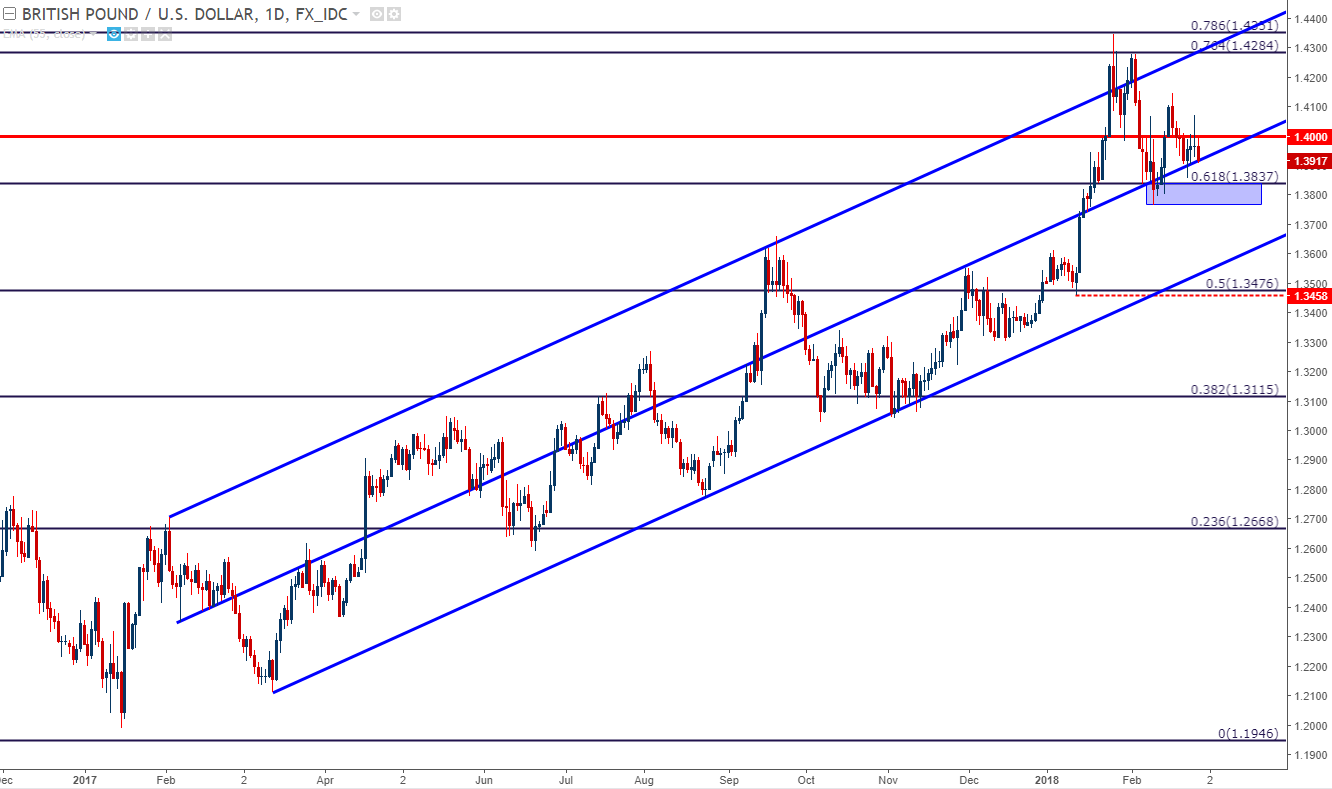
Chart prepared by James Stanley
AUD/USD for USD-Strength Scenarios
The pair that we’ve been following for USD-strength scenarios has been AUD/USD. While the Dollar’s bullish tendencies have been fairly suspect, particularly when taken with USD’s bearish trend last year, a bit of weakness has started to filter into AUD. The pair set a fresh two-year high in late-January, but was quickly met by sellers that started to reverse the move. That reversal hastened through the first part of February, and that move continued last week.
At this stage, AUD/USD is hanging on to support from a short-term bullish trend-line; with a down-side break opening the door to bearish continuation.
AUD/USD Hourly Chart: Bearish Continuation Potential
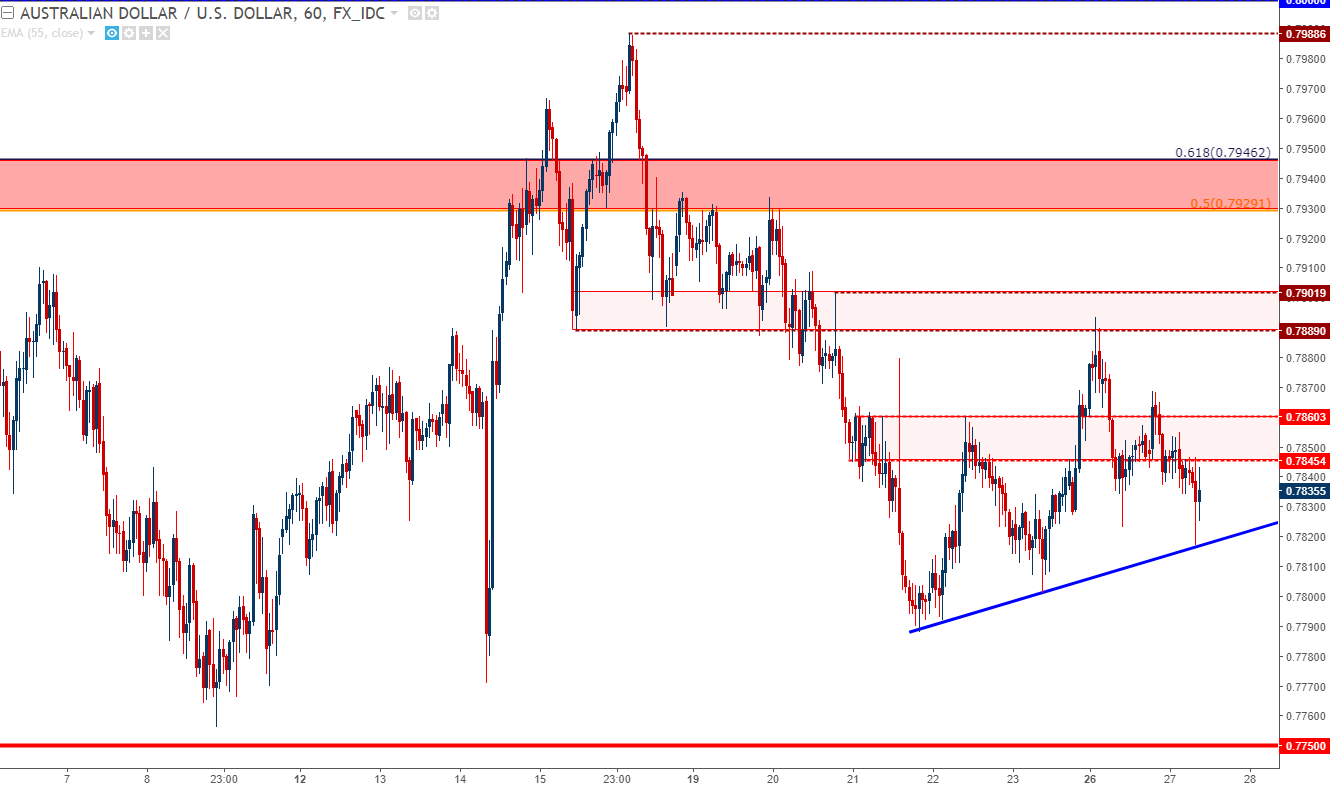
Chart prepared by James Stanley
USD/CHF for USD-Weakness Scenarios
For those that want to fade this recent strength in the US Dollar, USD/CHF could be an attractive candidate for such a theme. The pair is operating near an area of resistance that’s held the pair’s highs for the past couple of weeks, and this price action has moved very similarly to DXY, indicating how a bit of additional Franc-strength could help the short-side of the setup, particularly if we see USD-weakness comes screaming back.
USD/CHF Hourly Chart: Testing Resistance

Chart prepared by James Stanley
Support Play in the S&P
Yesterday saw the S&P 500 leave-behind the 61.8% retracement of the recent sell-off. This was a zone of resistance around 2750 that had held the highs over the past week. The natural question now is whether this area of prior resistance will bring on some element of fresh support; so, if a dip does develop around the next few days’ worth of drivers, this could be an interesting area to watch for support in the S&P 500.
S&P 500 Hourly Chart: Support Potential Around Prior Resistance, 61.8% Fibonacci Retracement
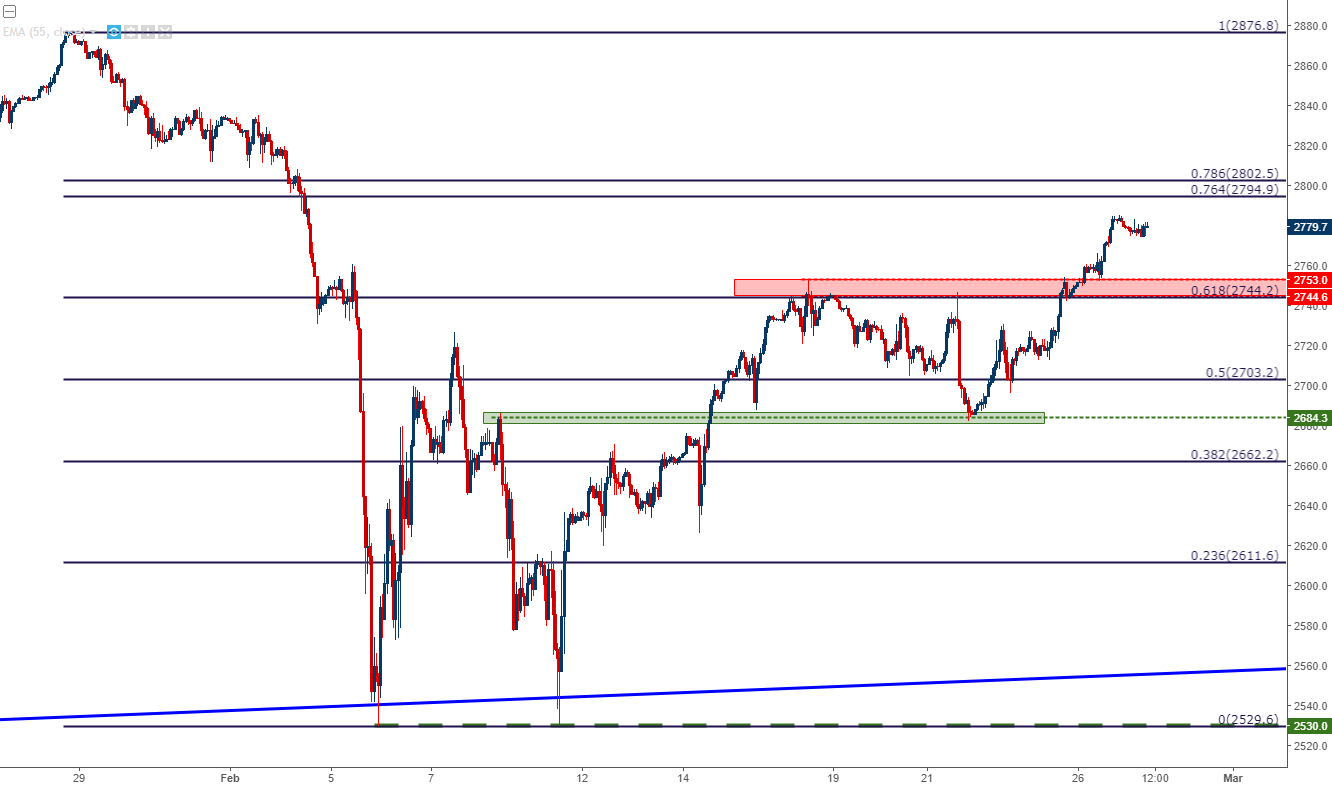
Chart prepared by James Stanley
To read more:
Are you looking for longer-term analysis on the Euro, the British Pound or the U.S. Dollar? Our DailyFX Forecasts for Q1 have a section for each major currency, and we also offer a plethora of resources on our EUR/USD, GBP/USD, USD/JPY, AUD/USD and U.S. Dollar pages. Traders can also stay up with near-term positioning via our IG Client Sentiment Indicator.
--- Written by James Stanley, Strategist for DailyFX.com
To receive James Stanley’s analysis directly via email, please SIGN UP HERE
Contact and follow James on Twitter: @JStanleyFX


