


Talking Points:
- GBP/USD remains messy near-term, and this could complicate short-term trading stances. On a longer-term basis, a confluent area of support around this month’s lows could remain as attractive for bullish setups in the pair.
- This week’s calendar is relatively light on UK issues, with Mr. Mark Carney making a speech on Friday as the highlight. More interesting to near-term Cable price action for this week will be larger macro trends around the Euro and the US Dollar.
- Are you looking to improve your trading approach? Check out Traits of Successful Traders. And if you’re looking for an introductory primer to the Forex market, check out our New to FX Guide.
If you’re looking for longer-term analysis on GBP or USD, click here for our Trading Forecasts.
GBP/USD Devoid of Near-Term Trends
In our last article, we opined on the messy nature of near-term price action in GBP/USD. While a pair of seemingly positive drivers availed themselves earlier in the month, bulls largely shrugged that news off while the pair swung wildly with larger, more macro-related themes in the US Dollar. This leaves short-term setups in the pair as a rather unattractive prospect, so in the effort of seeing the forest from the trees, we’re going to take a look at trends on longer-term charts and in the effort of establishing strategy for this week.
GBP/USD Weekly
The 2017 bullish trend in the pair remains, and we’re seeing support and resistance come-in from a Fibonacci retracement drawn around the Brexit move, taking the June 2016 high down to the December low. The 78.6% marker of that move helped to catch the top in late-January, and the week after produced lower-high resistance off the 76.4 marker of this same move. The 61.8% retracement has helped to set support on a couple of different occasions, as we had looked at last month. The bullish trend-line below connects the March, 2017 low to the August low; and this will be relevant when we move down to the daily chart for drawing a channel.
GBP/USD Weekly Chart
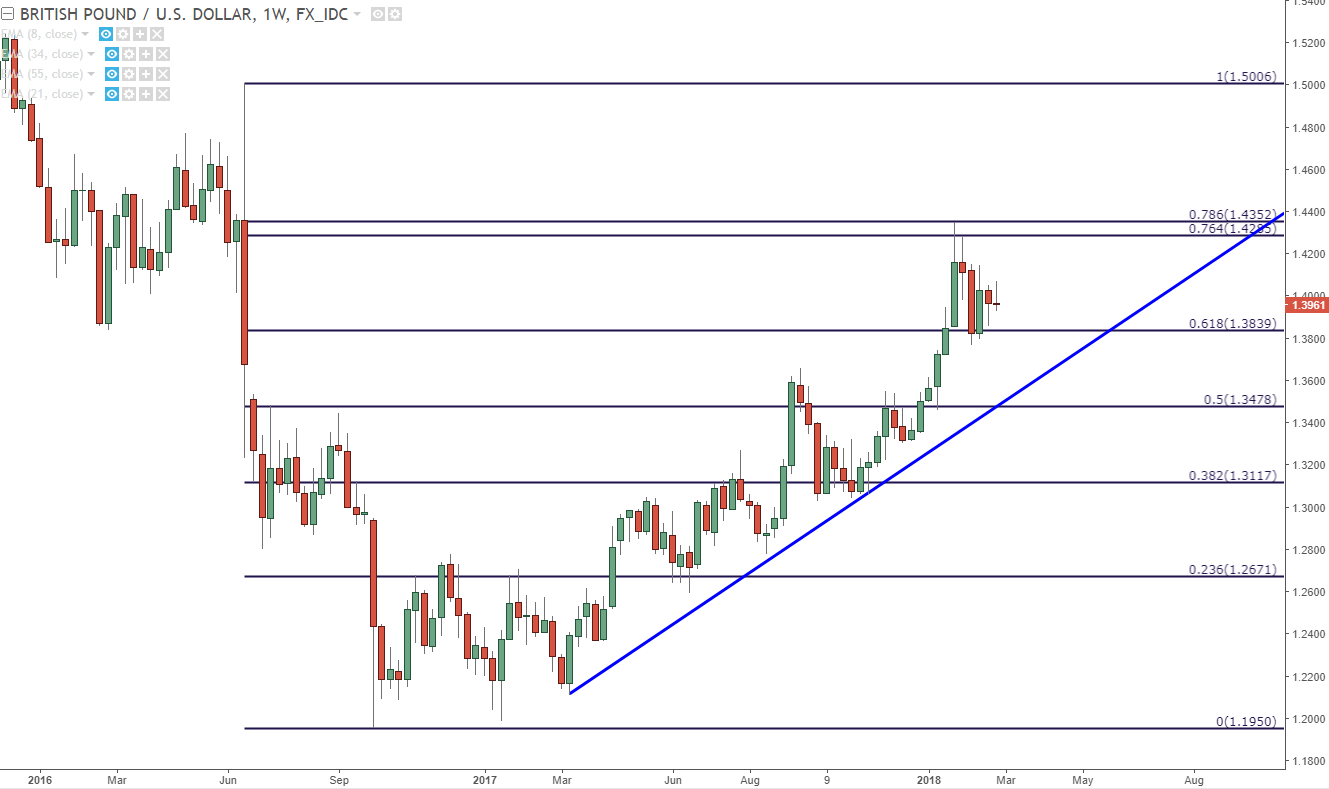
Chart prepared by James Stanley
GBP/USD Daily
Matters remain fairly clean on the daily, notwithstanding the past couple of weeks of indecisive movement, and this is where we can start to use that trend-line looked above to begin producing a bullish channel. The same angle of that trend-line can replicate two additional trend-lines: The first of which connects to the February 2, 2017 high; the second can be placed under the February 7th low to produce the channel’s mid-line.
GBP/USD Daily Chart
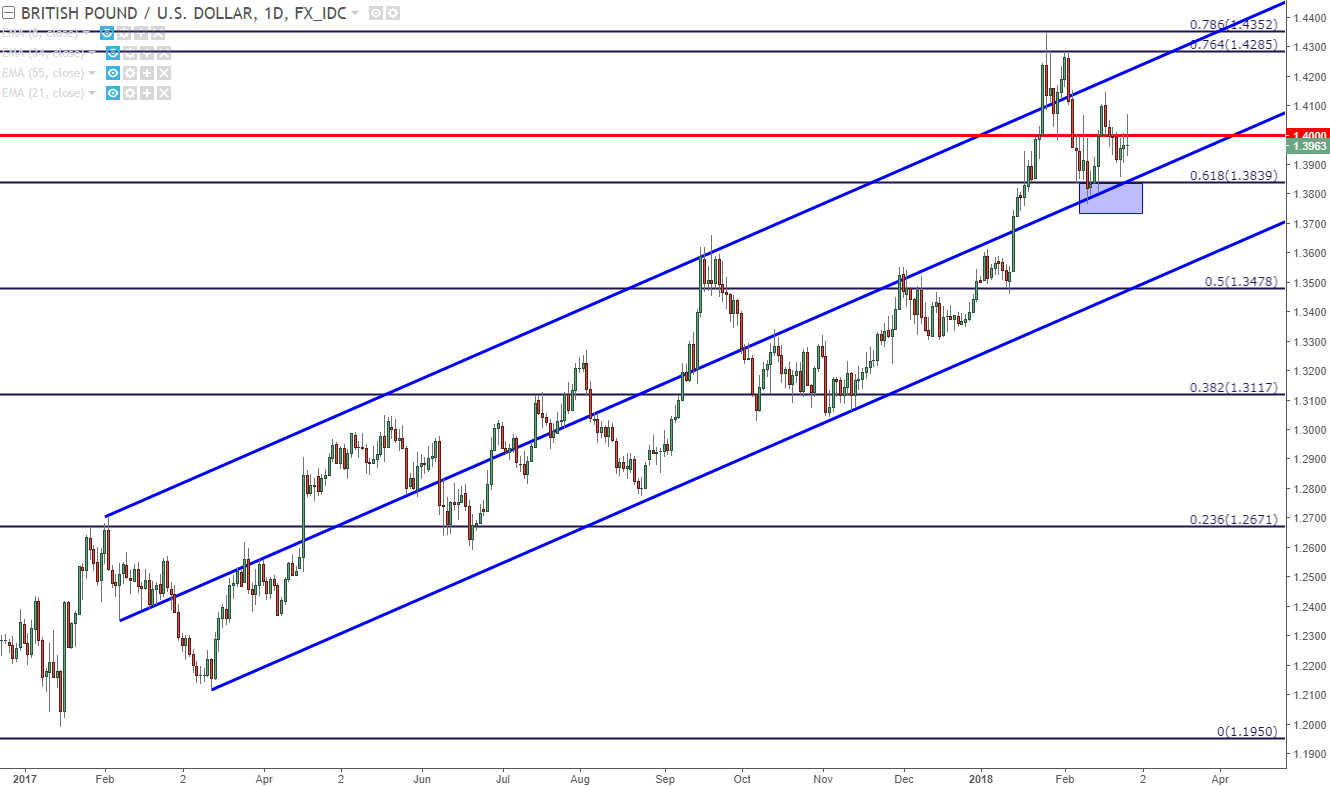
Chart prepared by James Stanley
As we can see on the above chart, the channel mid-line is crossing through the 61.8% Fibonacci retracement, producing an element of confluence that’s been showing over the past couple of weeks. The pair first started to test around this zone for support earlier in February, around the Bank of England’s Super Thursday. Prices caught a bid a week later after languishing near that support in the wake of the rate decision; but that bullish move didn’t last as buyers quickly lost motivation after testing above 1.4100.
This leaves price action in Cable in a rather undesirable area devoid of any near-term trends. More interesting, however, could be the longer-term setup, particularly in the event that support shows around this confluent area should a re-test be in the cards.
Higher low support above the February swing-low of 1.3765 could be construed bullishly, opening the door for topside setups in the pair. That observation could be made a bit more attractive based on how that higher low comes-in: If we do get support showing above 1.3799, which was the previous swing-low, this would be even more attractive as the sequence of higher-lows would’ve extended over a two-week period. Stops could be set below the February low with targets re-directed towards that 1.4000 psychological level.
GBP/USD Daily Chart: Higher-Low Support Zone Potential 1.3765-1.3839
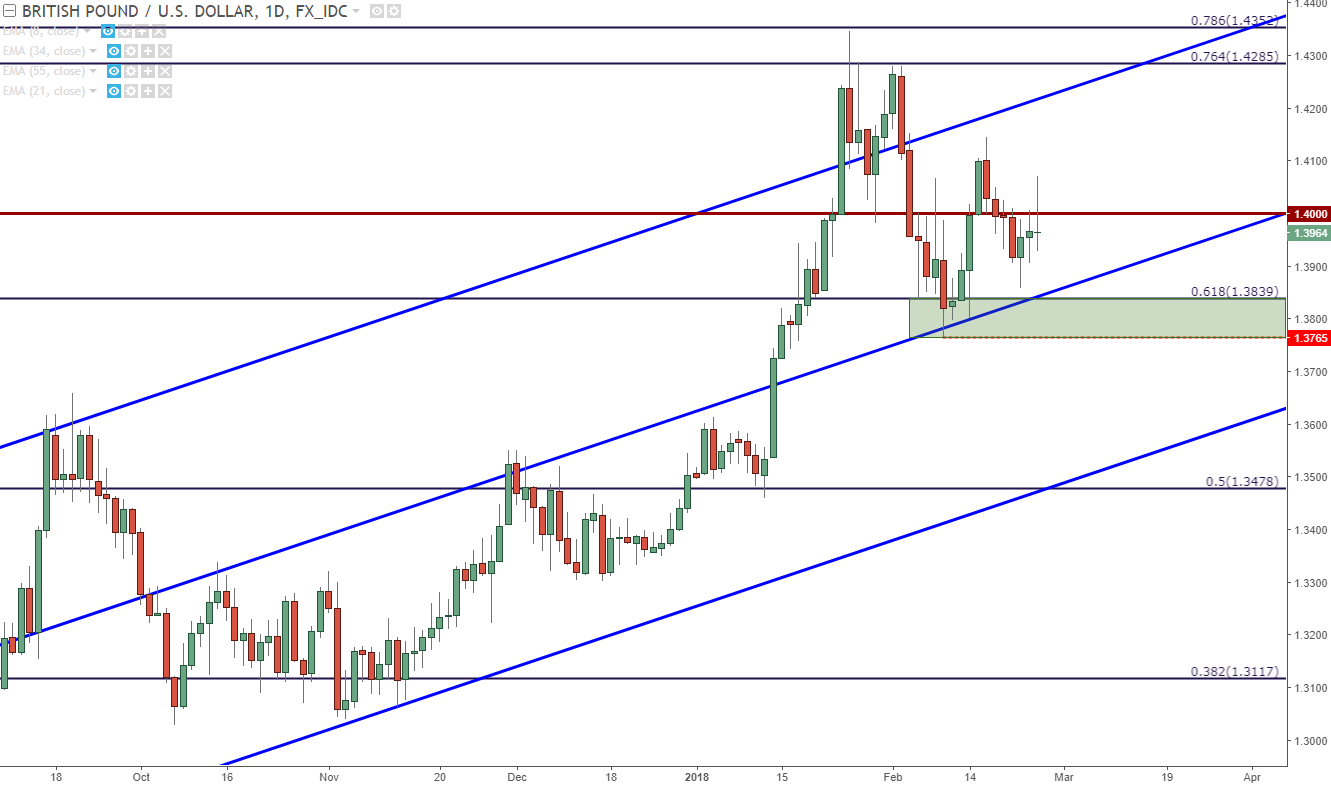
Chart prepared by James Stanley
To read more:
Are you looking for longer-term analysis on GBP/USD? Our DailyFX Forecasts for Q1 have a section specifically for GBP/USD. We also offer a plethora of resources on our GBP/USD page, and traders can stay up with near-term positioning via our IG Client Sentiment Indicator.
--- Written by James Stanley, Strategist for DailyFX.com
To receive James Stanley’s analysis directly via email, please SIGN UP HERE
Contact and follow James on Twitter: @JStanleyFX


