


Talking Points:
- U.S. CPI came-in below expectations at 2.2% v/s 2.3%. While this is above the Fed’s goal of 2%, much of the rise is being attributed to energy prices.
- The U.S. Dollar dropped on this morning’s print, and this continues the 2017 down-trend in the currency after last week’s NFP report brought upon a reversal around a key zone of resistance.
- Want to see the DailyFX Q4 Forecast on USD? Click here for full access.
To receive James Stanley’s Analysis directly via email, please sign up here
It was just a week ago that a n abysmal NFP print helped to push the Dollar back into its 2017 down-trend. And throughout much of this week, the Dollar was offered lower as sellers re-gained control of near-term price action. But as we walked into CPI on Friday morning, a bit of strength had begun to show ahead of the print, opening the door to the possibility of a deeper move of USD-strength.
This morning’s inflation read for September came in at 2.2%, just below the expectation of 2.3%. Core CPI printed at 1.7% versus a 1.8% expectation; so we had a slight amount of disappointment there as well. Reading within the number, and contributing to this move of USD-weakness on this +2% CPI print is the fact that much of those price gains came from energy prices. The net response was re-ignition of USD weakness as the Dollar tilted down to test this week’s lows:
U.S. Dollar via ‘DXY’: Fresh Two Week Lows on Inflation Disappointment

Chart prepared by James Stanley
This near-term move of USD-weakness continues the longer-term bearish trend that’s held in the Dollar this year. Last week saw resistance set in a key area that runs from 94.08-94.30, and since then sellers have taken over.
U.S. Dollar via ‘DXY’ Daily: 2017 Down-Trend Continues After Last Week’s Resistance Test
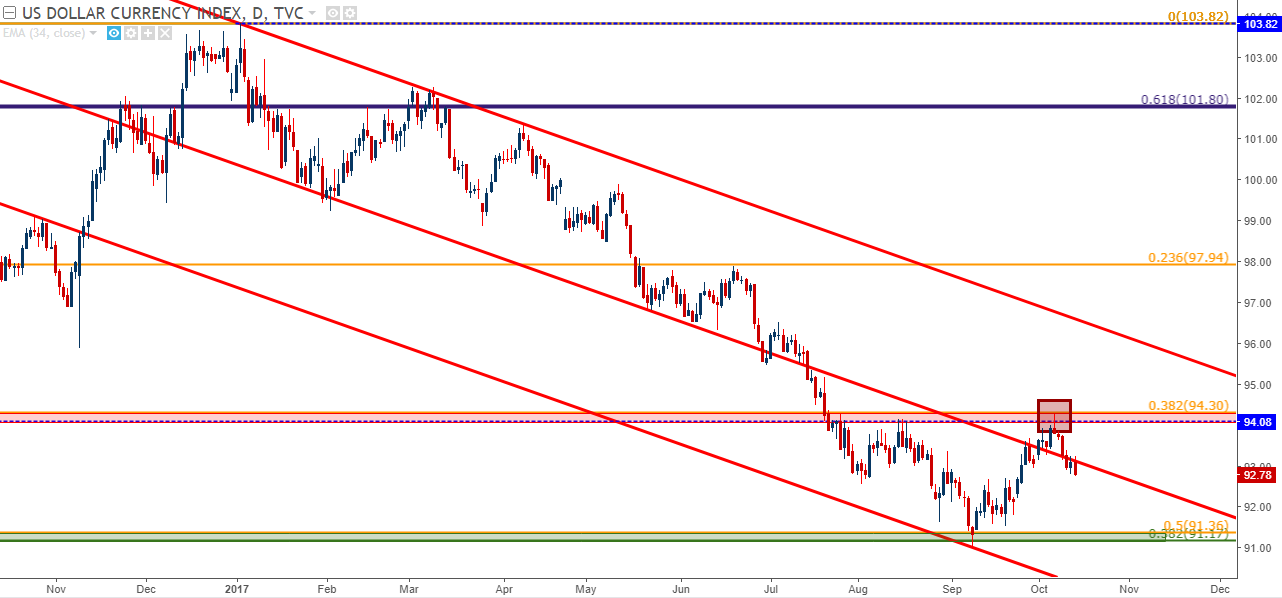
Chart prepared by James Stanley
While September inflation came-in below expectations, this still echoed continuing improvement after the summer swoon in us inflation figures. After the Fed hiked rates in March, CPI began to fall dramatically from a February high of 2.7% to a June low of 1.6%. As worries began to mount around how long that theme of weaker price growth might continue, Fed Chair Janet Yellen continued to say that she thought that weakness was transitory and that inflation would continue to improve. In the FOMC minutes released earlier this week, we learned that this sentiment isn’t necessarily the predominant opinion at the Fed, as multiple board members voiced concern that the slowdown seen in inflation may be more than transitory.
US CPI Climbs Back Above 2% in September
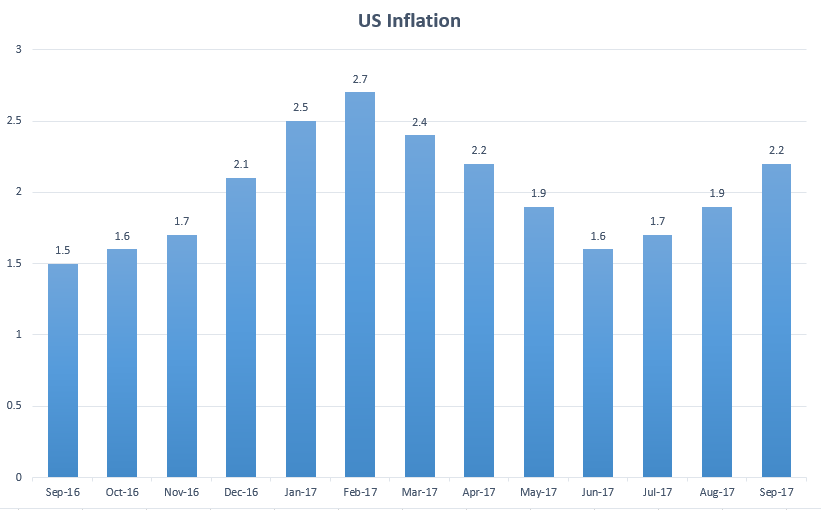
Prepared by James Stanley
Yesterday we looked at a series of setups around the U.S. Dollar ahead of this morning’s CPI print. Of particular interest in the theme of USD-weakness was the prospect of bullish continuation in EUR/USD. After a jaw-dropping run from sub 1.04 to begin the year to over 1.2000 in September, EUR/USD began to cool as we walked into Q4. Prices moved down to a confluent zone of support, at which point buyers began to step-in. This lasted for a little over a week as price action put in a grind near a long-term support zone, but as USD-weakness has re-fired after last week’s NFP report, EUR/USD has begun to move higher again, giving the appearance that the recent retracement may be nearing its end.
EUR/USD Hourly: Thursday Losses Reversed as Bulls Drive Higher post-CPI
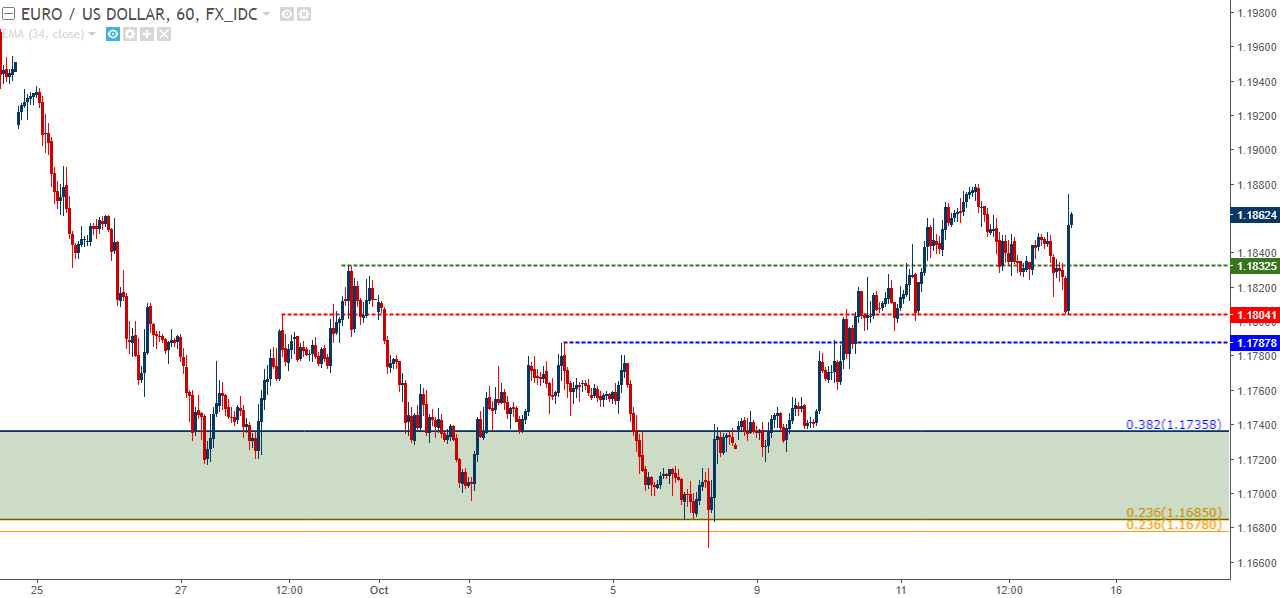
Chart prepared by James Stanley
We also looked at the top-side of NZD/USD with interest around the .7150 level to open the door for bullish continuation. With prices rising above that figure, traders can now begin to look for higher-low support in the effort of trading a deeper USD-selloff. Support showing around the prior point of near-term resistance around .7150 can open the door to such a setup, with eyes on stop losses below the previous swing-low around .7100.
NZD/USD Hourly: Kiwi Reversal Continues to Show
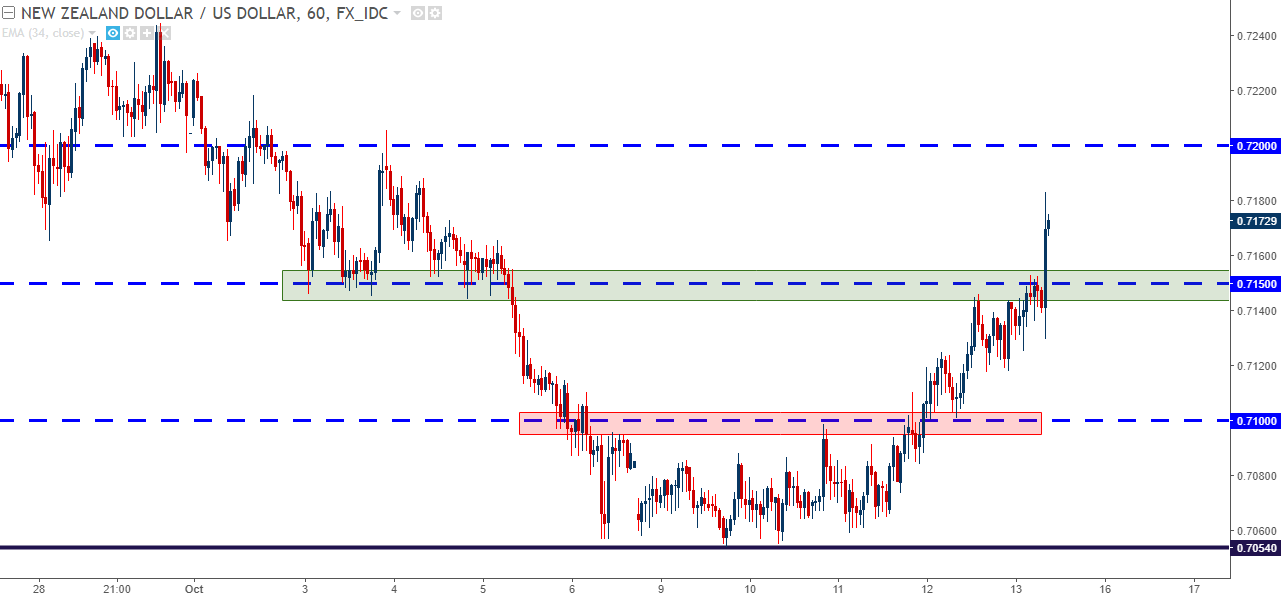
Chart prepared by James Stanley
We also looked at USD/CHF for a deeper bearish move after resistance began to show at a key area. This resistance printed on the under-side of a prior bullish trend-line, and this comes-in below the key level of .9770, which had previously helped to set the high in the pair for a few months before a topside breakout earlier in October faltered.
Swissy Hourly: Bearish Reaction to Confluent Resistance, Trend-Line + .9770
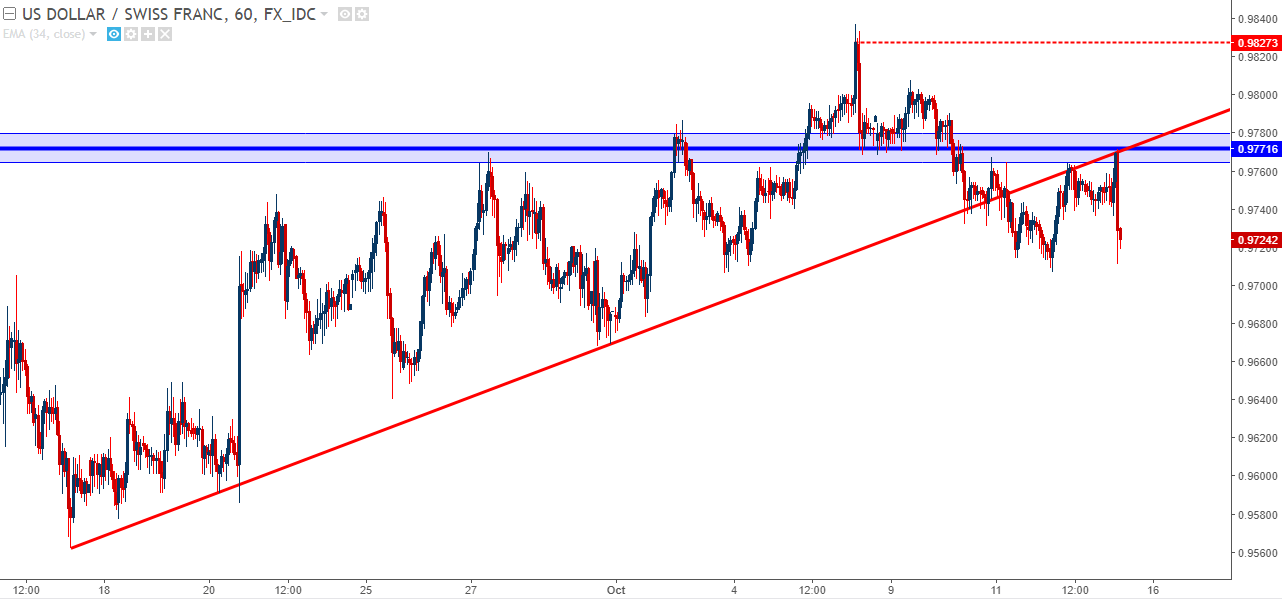
Chart prepared by James Stanley
Also of interest is a deeper move of strength in GBP/USD. Cable has been quite volatile this week, putting in a test of the 1.3000 psychological level after having traded above 1.3600 just a few weeks ago. But that 1.3000 test didn’t quite come to pass as buyers stepped-in about 25 pips before that level came into play, and since that low was set yesterday, a sparkling bullish rally has begun to show in the British Pound, at least on short-term charts.
GBP/USD Hourly: Cable Continues Impressive Rally After Yesterday’s Support Test
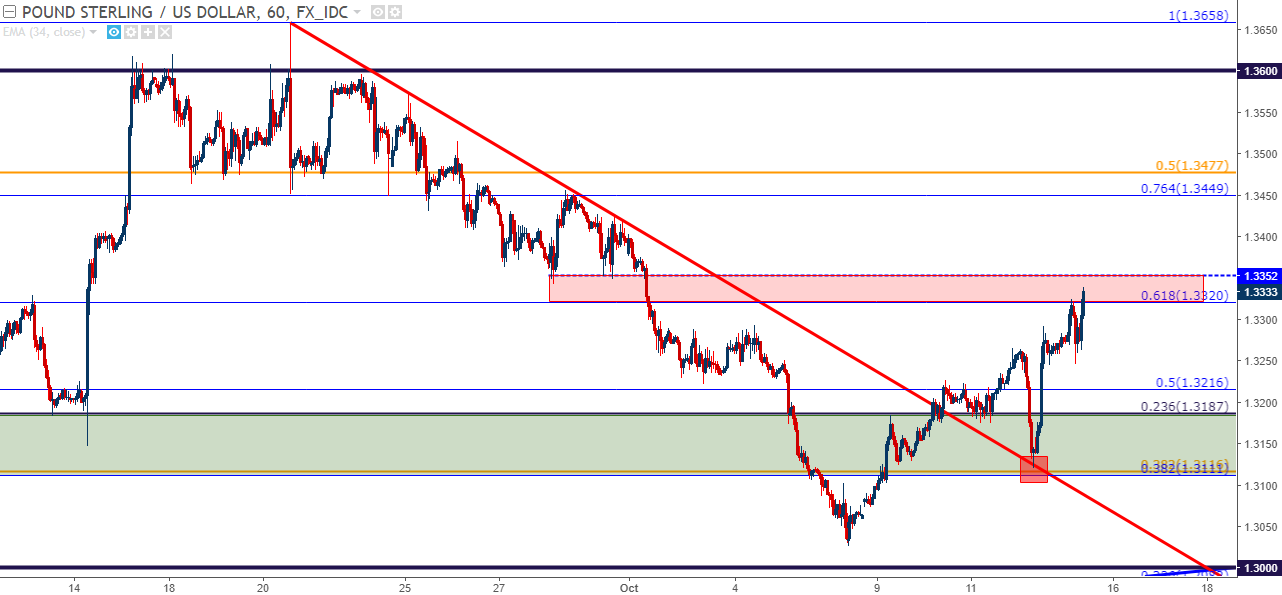
Chart prepared by James Stanley
--- Written by James Stanley, Strategist for DailyFX.com
To receive James Stanley’s analysis directly via email, please SIGN UP HERE
Contact and follow James on Twitter: @JStanleyFX


