Talking Points:
- Tomorrow brings a pivotal CPI print to the fray for U.S. markets with the release of September inflation figures.
- The U.S. Dollar has seen the bigger-picture trend of weakness show back-up after last Friday’s NFP report – will CPI give bears more ammunition to drive the Dollar lower?
- Want to see the DailyFX Q4 Forecast on USD? Click here for full access.
To receive James Stanley’s Analysis directly via email, please sign up here
Dollar Drops After FOMC Minutes
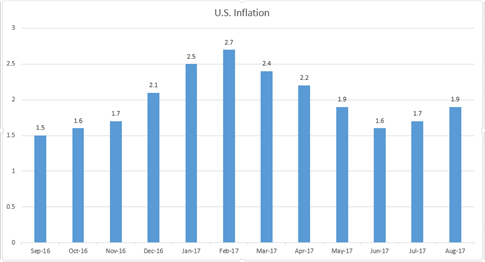
Yesterday’s FOMC minutes showed a growing concern within the Fed that the slowdown that’s been seen in inflation may be something more than transitory. After the Fed hiked rates in March, inflation plummeted from a 2.7% read all the way down to 1.6% in June. In the months since, we’ve seen that number climb ever so slightly, with a 1.7% print for July and a 1.9% reading for August: But at this point we remain below the Fed’s own 2% inflation goal, and this had previously raised a number of questions around the possibility of any near-term rate hikes out of the Fed. Tomorrow brings the most recent inflationary read out of the United States with the release of September figures, and this will likely provide some level of volatility as we move towards the close of the week.
U.S. Inflation Recovers After February-June Swan Dive
prepared by James Stanley
At the September FOMC meeting, Fed Chair Janet Yellen appeared to be laying the groundwork for another rate adjustment later in the year. A week later, while delivering a speech, Chair Yellen mentioned that sub-2% inflation may not be a hindrance to near-term rate hikes as the Fed continues to look at further normalizing policy. This had helped to firm-up the Dollar, as the 1.9% inflation that had just printed could open the door for another rate move, even though this is below the Fed’s target.
Since then, we’ve had a couple of detractors to that theme. Last week’s Non-Farm Payrolls printed at -33k, well below the expectation of +75k, and this was the first contractionary print in the number in over seven years. While that was being largely discounted due to Hurricanes Harvey and Irma that drove large portions of the U.S. economy into standstill during the month, it’s still an abysmal print that doesn’t exactly exude confidence around the labor market as the Fed evaluates taking a leap of faith by hiking rates while inflation is below-target. Around this print, the U.S. Dollar tested a key zone of resistance that runs from 94.08-94.30, at which point sellers began to take-over.
U.S. Dollar via ‘DXY’ Daily: Lower-High Resistance Shows in Zone from 94.08-94.30
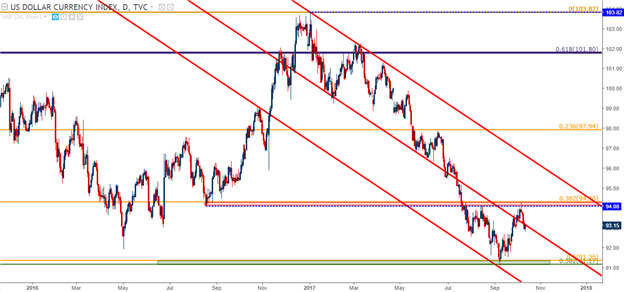
Chart prepared by James Stanley
Yesterday’s FOMC minutes brought another hit to the Greenback, as Chair Yellen’s optimism does not appear to be shared throughout the Fed. If the Fed is concerned about continued lackluster inflation, this could hold the bank back from meeting their expectation of four additional rate hikes going out to the end of next year. This could also make for a backdrop of continues weakness in USD as Central Banks in the U.K. and EU look at tighter policy options in the near-term. On the hourly chart below, we’re looking at the recent sell-off in DXY. While this move-lower has come in rather cleanly, there is an interesting area to look for lower-high resistance for bearish continuation strategies in the Dollar, identified below with red boxes.
Tomorrow brings CPI for the month of September. The expectation is for a 2.3% headline print to go along with a 1.8% expectation for Core CPI. If this does come-out below those expectations, we could see this move of USD-weakness go into the next gear.
U.S. Dollar via ‘DXY’ Hourly: Potential Lower-High Resistance Zone Applied
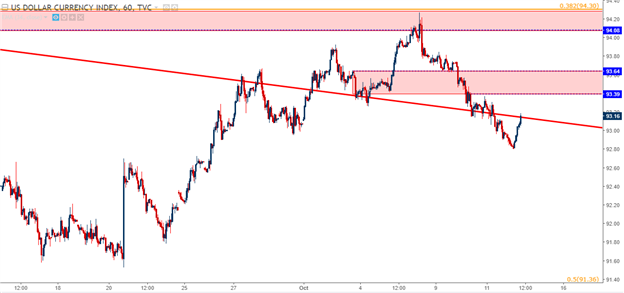
Chart prepared by James Stanley
EUR/USD Strength Continues
While a re-ignition of USD-weakness has shown since last Friday’s NFP report, EUR/USD has moved-higher in the direction of the longer-term trend. After grinding around a key zone of longer-term support for the better part of two weeks, EUR/USD bulls have begun to take over to drive the move-higher. On the daily chart below, we’re looking at that response to support as bullish price action over the past couple of days have lifted prices higher.
EUR/USD Daily: Bounce From Longer-Term Support Zone
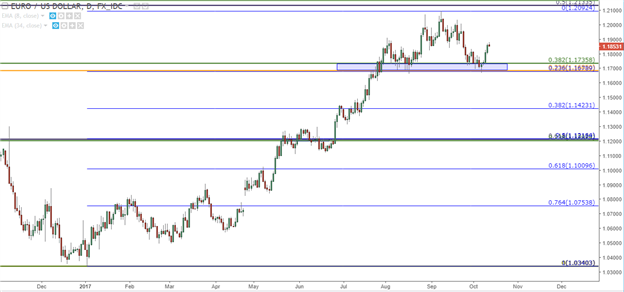
Chart prepared by James Stanley
Much of this topside run has taken place in a rather consistent fashion with very little pullback since last week’s Non-Farm Payrolls report. The issue that EUR/USD bulls may want to consider is just how smoothly this trend has come-in, and the fact that this recent burst of strength may need a breather before deeper resistance levels might be taken out. On the chart below, we’ve identified an area that could be interesting for such an observation. If we do see this near-term trend-pullback, support showing between 1.1800-1.1835 can open the door for top-side continuation under the presumption that this shorter-term bullish theme will continue into the longer-term topside trend.
EUR/USD Hourly: Potential Higher-Low Support Zones Applied
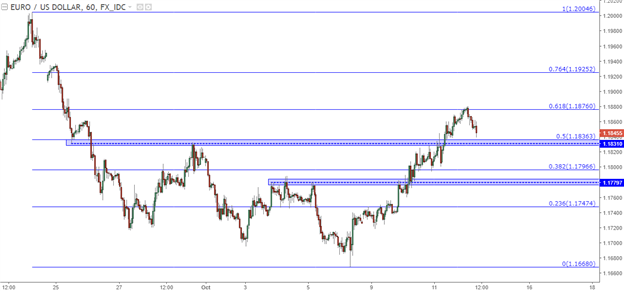
Chart prepared by James Stanley
Bearish Price Action Back in the British Pound
Meanwhile, matters in the British Pound are a bit more active on the morning, and this continues the drama around the currency that’s continued to show since the Bank of England’s September rate decision. At that meeting, BoE Governor Mark Carney warned that rate hikes might be on the horizon as the U.K. grapples with aggressive inflation nearing 3%. This sparked a spate of strength in Sterling that lasted for about a week as GBP/USD moved-up to 1.3600 after having traded below 1.2800 not more than a month earlier. But a large chunk of that bullish move was retraced in the week after, and as Dollar weakness began to show again after last Friday’s NFP report, GBP/USD began to trend-higher above a key zone of longer-term support/resistance.
In the early-portion of this morning’s Euro session, reports began circulating that Brexit discussions have hit a deadlock. The EU’s chief negotiator, Michel Barnier, said earlier in the day that there hasn’t been much progress, and talks are essentially at a standstill. The UK’s Brexit minister David Davis’ response wasn’t all that encouraging, as he responded that the British government is preparing for all scenarios, and if a good deal is not available the U.K. has to be prepared for alternative arrangements. This was largely construed as GBP-negative as that recent bullish move was mostly erased by this morning’s sell-off.
GBP/USD Four-Hour: Bears Come Back into the British Pound
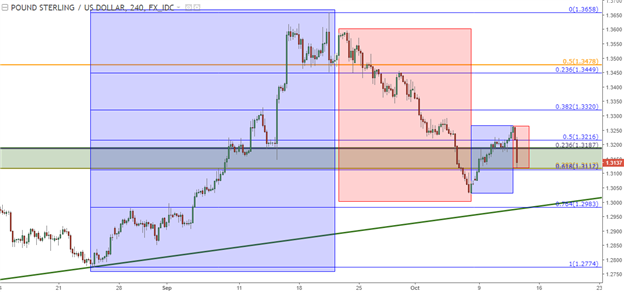
Chart prepared by James Stanley
At this point, price action is testing the bottom portion of a longer-running zone of support that shows from 1.3117-1.3187. Confluent with that area is a trend-line projection from the recent bearish move that’s currently showing as near-term support. A re-test of the from 1.3175-1.3187 as lower-high resistance can open the door to short-side setups, with targets cast towards the 1.3000 psychological level.
GBP/USD Hourly: Support at Bottom of Zone, Trend-Line Projection
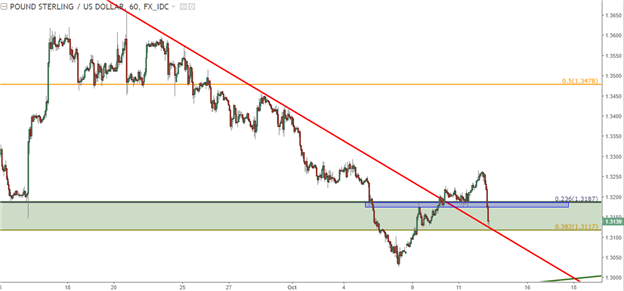
Chart prepared by James Stanley
--- Written by James Stanley, Strategist for DailyFX.com
To receive James Stanley’s analysis directly via email, please SIGN UP HERE
Contact and follow James on Twitter: @JStanleyFX


