


Talking Points:
- The remainder of this week brings some interesting push points for the U.S. Dollar, with today at 2PM ET bringing the release of FOMC minutes from the September rate decision. On Friday, we get CPI and Advance Retail Sales, and each of these outlays can provoke or propel the U.S. Dollar.
- The Greenback has turned lower after last Friday’s NFP report saw USD run into a heavy zone of resistance.
- Want to see the DailyFX Q4 Forecast on USD? Click here for full access.
To receive James Stanley’s Analysis directly via email, please sign up here
Today at 2PM brings the release of FOMC minutes from the bank’s September rate decision. The September rate decision was an interesting outlay from the Fed: This is when the bank announced that they would soon begin balance sheet reduction; but the part that probably caught most off-guard was just how hawkish they were pertaining to rate hikes to the end of this year and next. The Fed laid the groundwork for another rate move in December, and the dot plot matrix indicated that the median expectation at the bank is for another three rate hikes next year in 2018; followed by two in 2019 and one in 2020.
While the expectation of four hikes going out to the end of next year wasn’t necessarily anything new, as this was previously forecasted by the Fed; the fact that the bank continues to remain hawkish even in-light of a slowdown in US data, particularly around inflation, likely caught many by surprise. This brought in a quick move of USD strength as DXY tested a key area of near-term resistance that had been set earlier in September. There was still some skepticism, however, as the Dollar turned-lower off of that resistance level around 92.67.
U.S. Dollar via ‘DXY’ Hourly: FOMC-Fueled USD (Blue) into Resistance, Higher-Low (in Green)
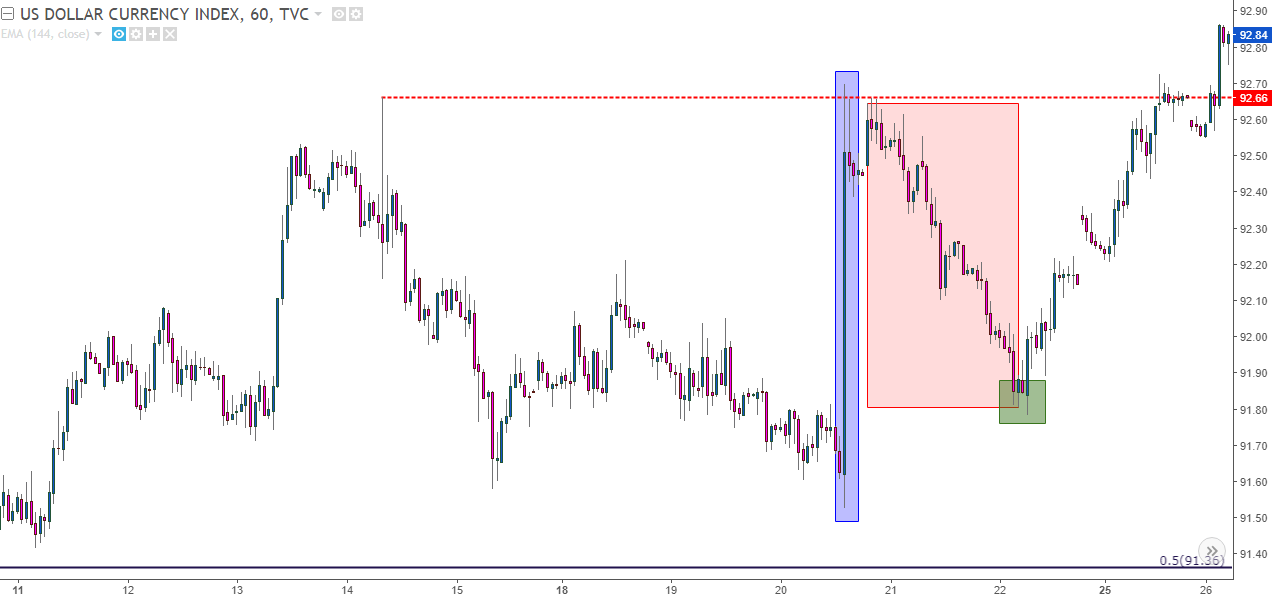
Chart prepared by James Stanley
Not more than one week later, Fed Chair Janet Yellen was giving a speech in which she mentioned that inflation below the Fed’s 2% goal would not necessarily be a hindrance to additional rate hikes. This gave another boost to the Greenback, and DXY moved up to test another level of resistance around 93.63. That move is indicated in Green on the below chart, and after setting another higher-low shortly after that resistance test, bulls took over to drive prices-higher. Eventually, price action trickled towards the longer-term zone of resistance in DXY that runs from 94.08-94.30.
It was during last Friday’s NFP report that this theme became a bit more interesting, as an abysmal print of -33k dented that optimism that was driving the Dollar higher. Sure, the Fed might be willing to hike rates with persistently low inflation, but are they really going to take that leap of faith if they’re seeing lackluster inflation AND employment growth? On the other hand, many were discounting that NFP print given that Hurricanes Irma and Harvey had sent large chunks of the U.S. economy into standstill during the month; and the wage growth that was seen in that report was rather brisk with Average Hourly earnings growing by 2.9%.
Nonetheless, the response in USD was not bullish. In short order, the U.S. Dollar had turned from that area of resistance, and since then, DXY has been heading lower throughout this week as we near the release of FOMC minutes later this afternoon.
DXY Hourly: USD Runs on FOMC (blue), Chair Yellen (Green) into Resistance at NFP (Red)
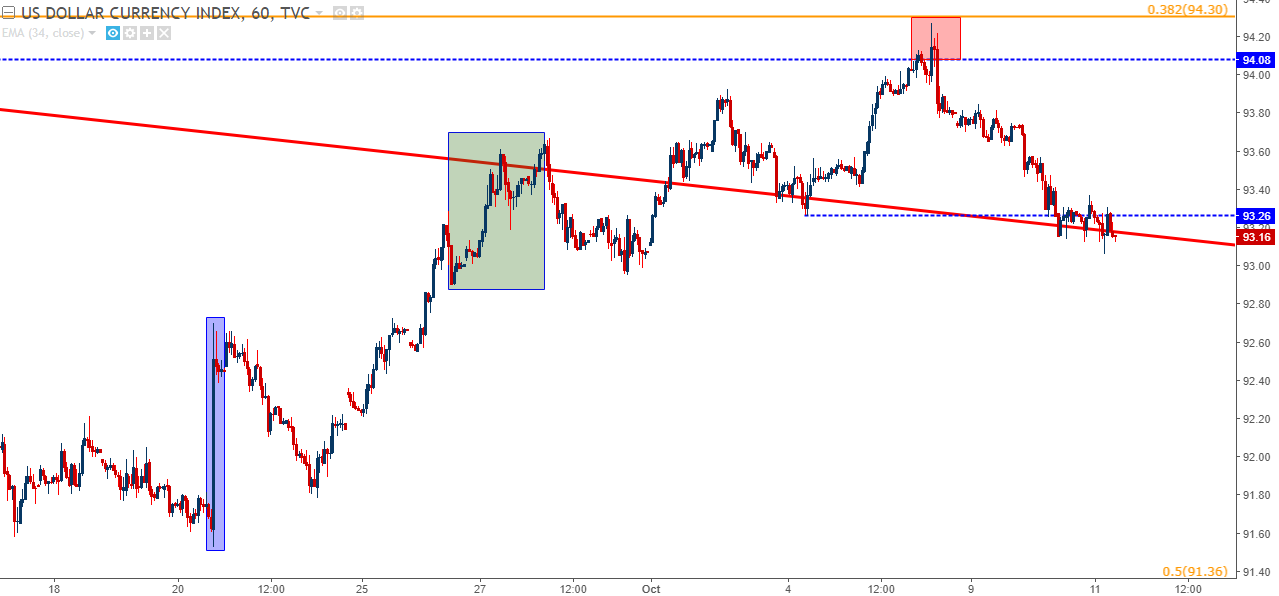
Chart prepared by James Stanley
This leaves the Greenback in an interesting spot as we approach the release of FOMC minutes later today, and later in the week, we get inflation and advance retail sales, so volatility around the Dollar likely isn’t done after today.
The bigger question here for the Greenback is one of longer-term dynamics: As in, will the strength that was seen in the final few weeks of September find higher-low support to continue higher? Or will the bigger picture, longer-term down-trend remain in force as sellers come back-in to DXY? On the chart below, we’re looking at the 2017 down-trend in the U.S. Dollar as shown in DXY.
U.S. Dollar via ‘DXY’ Daily: 2017 Down-Trend Runs into Resistance
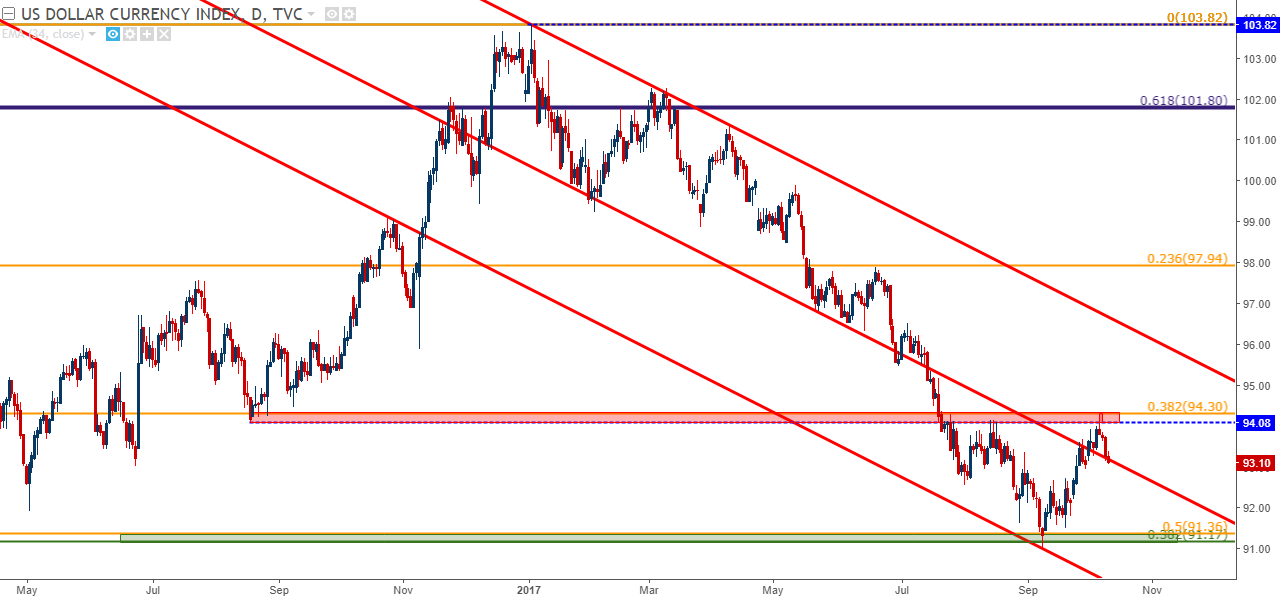
Chart prepared by James Stanley
On that topic of inflation, this was another quasi-positive factor for the U.S. economy in September. Inflation had fallen from a February high of 2.7% to a June low of 1.6%; not very encouraging for a growing economy looking at tighter monetary policy. But in July, that down-trend ceased as inflation came-in a bit higher at 1.7%, and then last month we got August inflation numbers showing a print of 1.9%. Friday brings the release of September inflation figures, and this could be the next push point for USD after FOMC minutes as markets grapple with the prospect of an additional rate hikes in 2017 and 2018.
U.S. CPI Rises to 1.9% in August: September Figures Released on Friday

prepared by James Stanley
Strategy Around the U.S. Dollar
We’ve been discussing a few different setups on either side of the U.S. Dollar as this recent theme of strength has shown. For USD-weakness strategies, EUR/USD remains attractive as markets continue to try to get in-front of any potential tightening that may take place in Europe. The British Pound is catching bids, as the prospect of a rate hike from the Bank of England does not seem to far off; and on the other side, Yen weakness could provide a fertile backdrop for long-USD strategies if we do, in fact, see this theme continue. And the Australian and New Zealand Dollars can be looked at in a similar light, as mechanisms to look for USD-strength to continue.
EUR/USD
On the short side of the Dollar, EUR/USD remains attractive. Many grapple with the prospect of rate hikes from the ECB with little expectation for it actually happening. But – when trading spot, the prospect of something actually happening carries less bearing than markets thinking/expecting that it COULD happen (think BoE rate hikes circa 2014 that never really materialized yet drove Cable above 1.7000).
This has been the Euro for much of 2017. The ECB has been evasive on the topic of stimulus exit, but as growth and inflation and leading indicators like PMI’s have remained positive – expectations for an eventual exit have continued to grow. At ECB rate decisions in April and June, when asked point blank whether the ECB had discussed stimulus, Mario Draghi replied that they hadn’t. This brought a couple of weeks of pause to the bullish Euro trend, but when the same thing happened in July – there was no pause; only more buying. The same thing happened at Jackson Hole in latter-August: Draghi didn’t even touch monetary policy in his speech, instead talking about the benefits of open borders, and the Euro continued to rally above the vaulted psychological figure of 1.2000.
As USD-strength began to show in September, EUR/USD finally put in some element of retracement. Prices slid down to a key zone of support which, up to this point, has held the higher low around the 23.6% marker of that most recent major move. We published an Analyst Pick on EUR/USD earlier this week, and this pair will likely remain as one of the more attractive ways to gain short-USD exposure in the near-term.
EUR/USD Daily: 2017 Bullish Trend Poses 23.6% Pullback to Confluent Support Zone
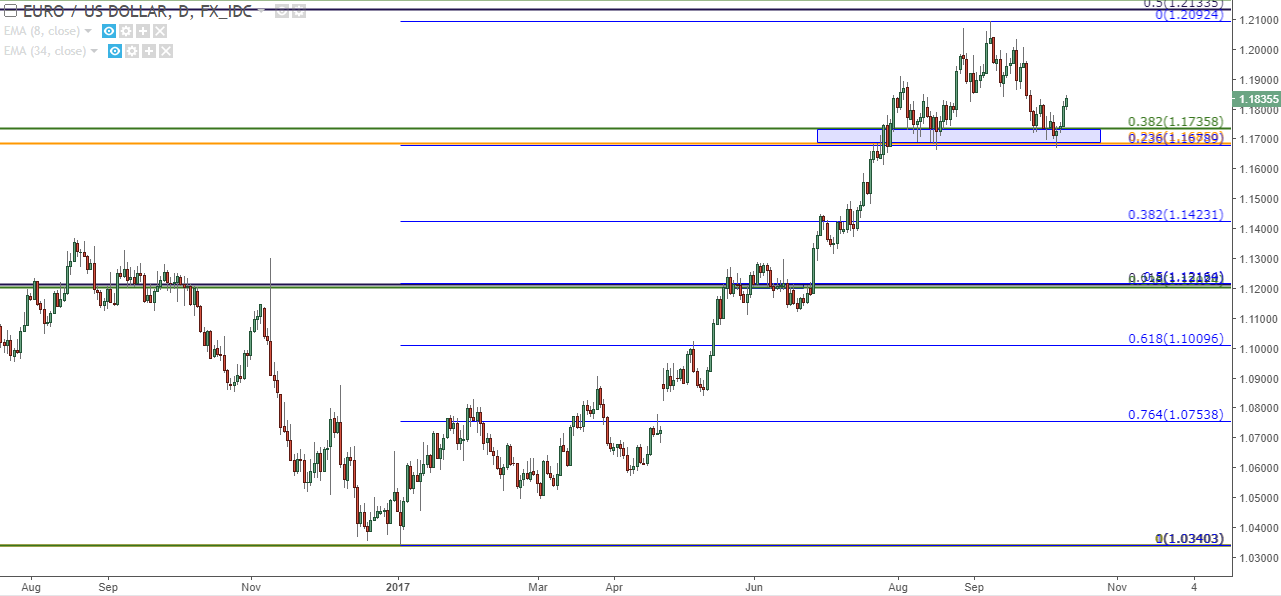
Chart prepared by James Stanley
On the long-USD side of the coin, USD/JPY could remain as attractive. If we are, in fact, at the early stages of a larger-move in USD, the divergent policy tracks of the Fed and the BoJ could provide a comfortable backdrop for bullish positions. We heard from the BoJ recently, and that bank appears to be nowhere near tighter policy options: In-fact, there was even a dissenting vote at that meeting for even more stimulus. And this is for a bank that already owns 75% of their own ETF market…
Nonetheless, expectations matter. And if the BoJ is expected to remain dovish, which most signs are pointing to, and if the U.S. Dollar continues to gain – the top-side of USD/JPY remains attractive. This setup is not without risks, as the potential for another flare in the situation revolving around North Korea could produce another hit to the pair should risk aversion begin to show again.
USD/JPY Four-Hour: Pullback into Confluent Support Zone After September’s Bullish Run
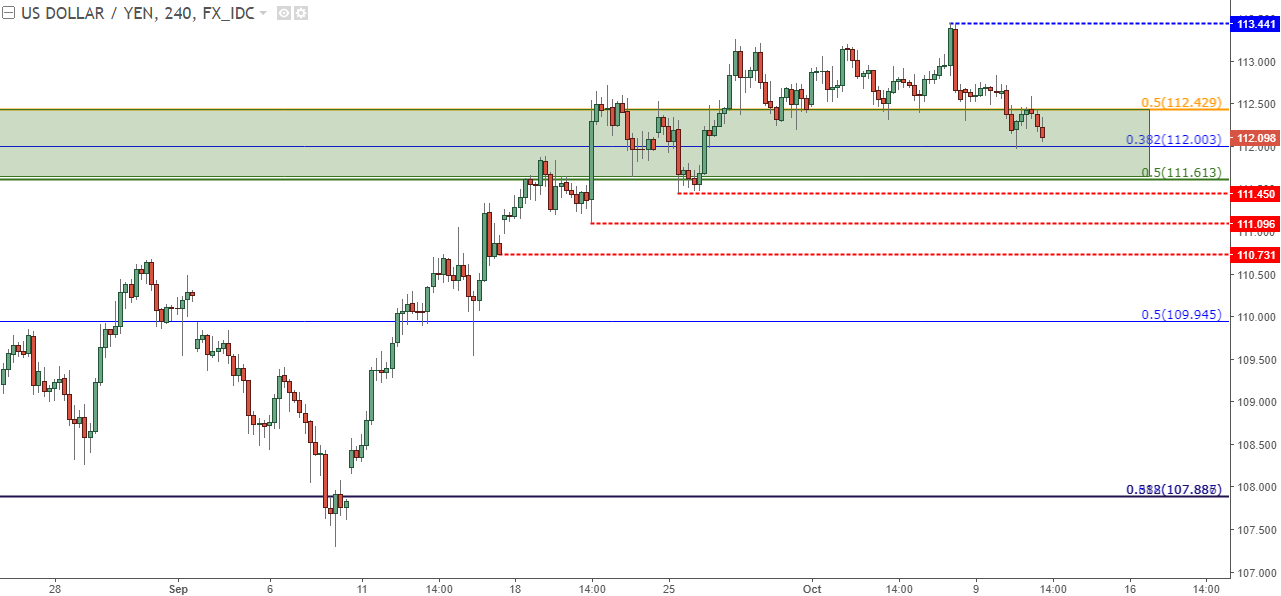
Chart prepared by James Stanley
--- Written by James Stanley, Strategist for DailyFX.com
To receive James Stanley’s analysis directly via email, please SIGN UP HERE
Contact and follow James on Twitter: @JStanleyFX


