


Talking Points:
- This morning’s NFP report came-in rather weak, with a headline print of -33k versus the expectation of +80k.
- The initial response was USD-strength as DXY ran-up to a key zone of resistance, likely being driven by the surprising print in Average Hourly Earnings.
- DailyFX Q4 Forecasts have just been released - Click here for full access.
To receive James Stanley’s Analysis directly via email, please sign up here
This morning’s Non-Farm Payrolls report was pretty bad. The headline print came in at -33k versus the expectation of +80k, and this was the first contraction in Non-Farm Payrolls since April of 2011. But within the report was another data point that brought a completely different message, and that was an improvement in average hourly earnings – up.5%. The expectation was for monthly growth of .3% and this is after a year that’s seen this indicator fluctuate between .1 and .3%. Average hourly earnings coming-in at .5% is a big surprise, and this speaks to one of the primary pain points of the Fed and their rate normalization goals as inflation has been a lagging factor for the Central Bank.
Given that expectations for the headline number to come in rather soft after Hurricanes Harvey and Irma threw a large portion of the U.S. economy in standstill throughout September, and we’re likely seeing at least some dismissal of the disappointing headline print. The immediate reaction in markets to this morning’s NFP report was a quick pop of USD-strength as DXY ran into a key zone of resistance that runs from 94.08-94.30. This equates to a fresh two-month high for the Greenback, and a sustained break above 94.30 could open the door for a bigger-picture move of USD-strength.
U.S. Dollar via ‘DXY’ Daily: Test of Key Resistance Zone (94.08-94.30) After NFP
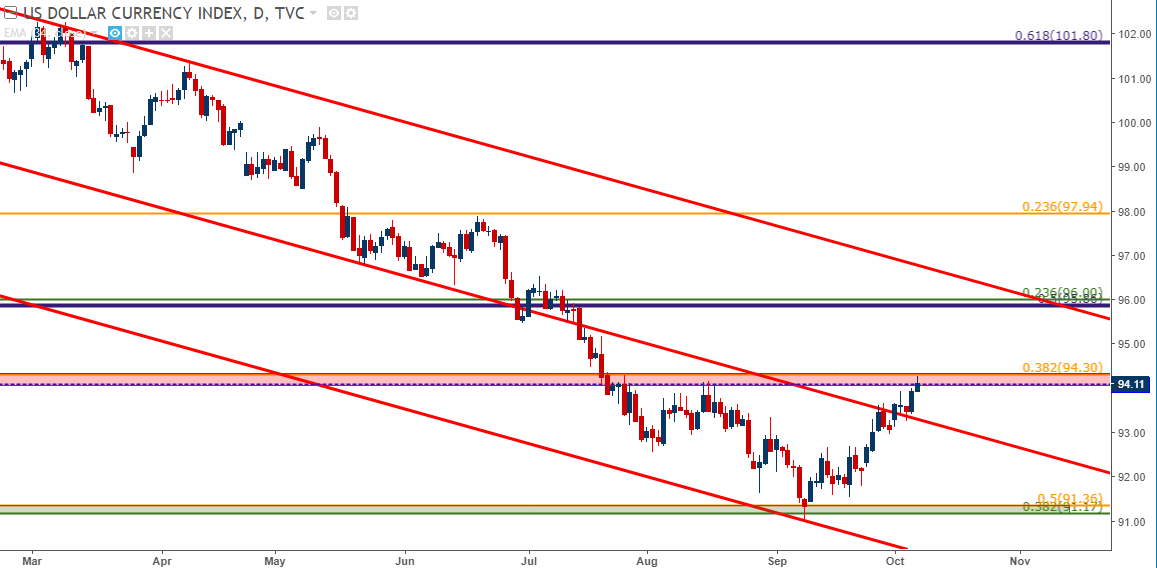
Chart prepared by James Stanley
Going along with that move of USD-strength has been a deeper test of support in EUR/USD. Going into the release, prices had found a few hours of support at the Fibonacci level of 1.1685, which is at the bottom of a support zone that we’ve been following. As that move of USD-strength began filtering-in shortly after the release, prices ticked below the Fibonacci level to find support just above the August low at 1.1662. For those looking to fade this move of USD-strength, EUR/USD can remain as an attractive candidate, driven by the fact that bears were unable to create much significant drive in price action even with the backdrop of a stronger U.S. Dollar. On the chart below, we’re looking at EUR/USD working with this zone of support, with deeper levels applied based on July and August swing-lows.
EUR/USD Four-Hour: Support Test After USD-Strength Shows post-NFP
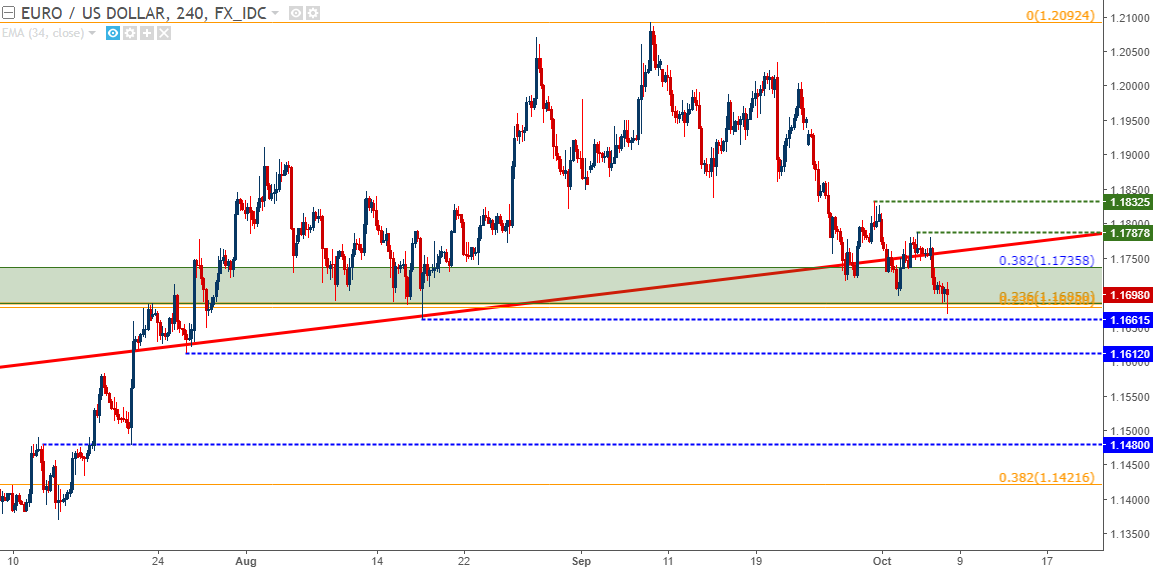
Chart prepared by James Stanley
While EUR/USD continues to cling to prior support, the British Pound isn’t seeing the same type of luck. Sterling continues to shed value after Theresa May’s press conference, and it appears as though a re-test of 1.3000 will soon be in the cards. We had looked at prior support structure in GBP/USD in the effort of topside continuation after the BoE’s hawkish warnings, but there has been little stoppage or slowdown to the sell-off being seen in the Pound. Given the veracity with which declines have come-in, traders would likely want to avoid bullish reversal strategies until more confirmation of support presents itself. Maybe 1.3000 is it? But at this point, guessing where that low comes in is very much like trying to catch a javelin in mid-flight.
GBP/USD Four-Hour: Brutality in the British Pound

Chart prepared by James Stanley
Over the past week, we’ve been focusing-in on AUD/USD for potential long-USD plays. While that sell-off in GBP/USD is attractive, there are quite a few ancillary factors that could create dissension in the trade; namely the fact that the Bank of England is looking at potential rate hikes in the near-term.
The Australian Central Bank, however, does not have the same types of issues to contend with. There are little hopes for any near-term moves out of the RBA, and this, when combined with a strong U.S. Dollar being driven by higher rate expectations as we move towards the December FOMC meeting, can help to drive bearish price action in AUD/USD.
After struggling to hold above the .8000 level in July and then in August, a rather aggressive reversal began to show in latter-September. As that theme of USD-strength has continued through the end of September and into October, Aussie has continued to drive below prior support levels, and we’re currently seeing support show around the .7750 psychological level, which also happens to be the February/March 2017 swing-high.
AUD/USD Daily: Fresh Two-Month Lows, Current Support at .7750
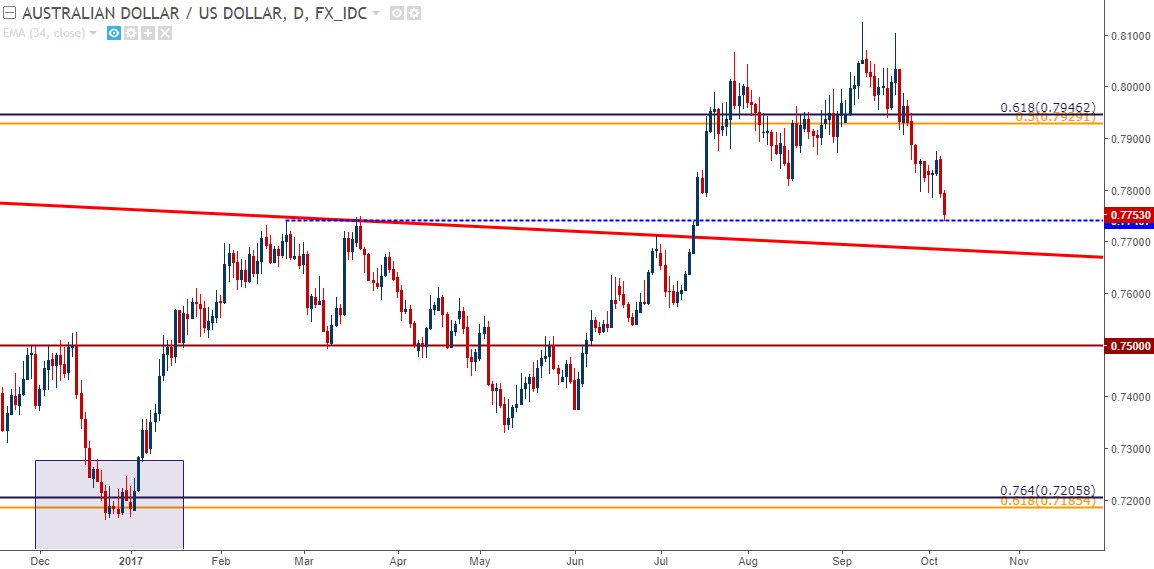
Chart prepared by James Stanley
Also in the stream of USD-strength, we’ve been following USD/JPY. Just last week, USD/JPY traded above a key zone of support/resistance that runs from 111.61-112.43. After resistance began to show around 113.25, the pair ranged as we moved towards this morning’s NFP report. As USD strength came-in, USD/JPY posed a quick topside move to punch up to a fresh two-month high.
If we do see a continuation of USD-strength as markets begin to anticipate a potential rate hike in December, the bullish side of USD/JPY could remain as attractive. The Bank of Japan is nowhere near tighter policy options; meanwhile the Fed is expected to be tightening policy through both balance sheet reduction along with continued rate hikes. This could provide a strong backdrop for continued gains in USD/JPY, with the one potential draw-back being a re-flare of the situation surrounding North Korea.
On the chart below, we’re looking at a key resistance level atop USD/JPY price action, as a test of this deeper points of resistance opens the door for a ‘higher-low’ to show at or around prior resistance (~113.25).
USD/JPY Daily: Fresh Two-Month Highs, Range Resistance ~114.50 In-Focus
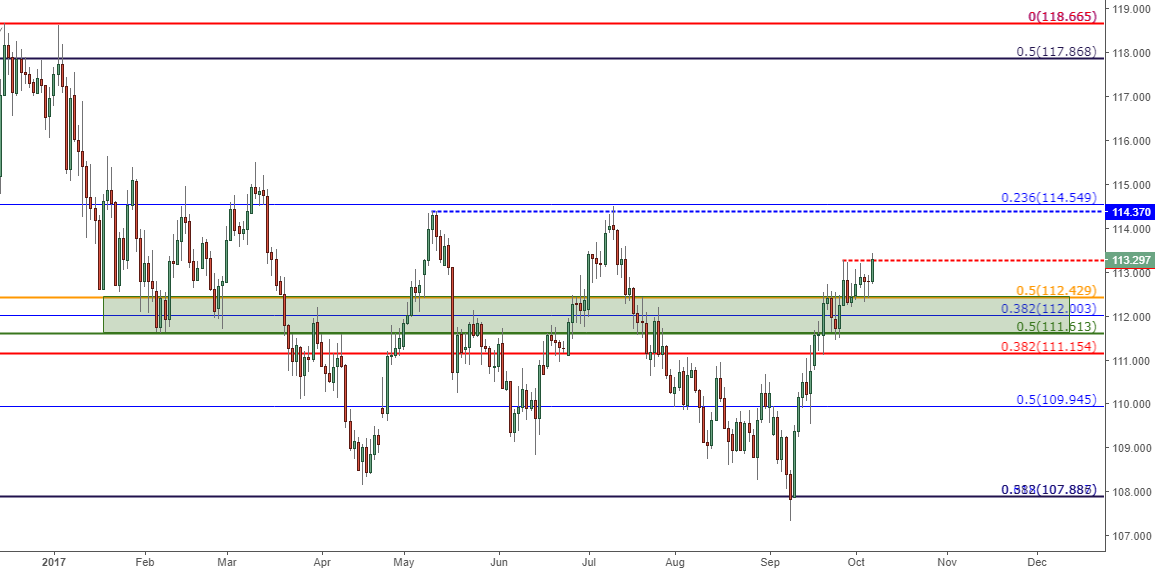
Chart prepared by James Stanley
--- Written by James Stanley, Strategist for DailyFX.com
To receive James Stanley’s analysis directly via email, please SIGN UP HERE
Contact and follow James on Twitter: @JStanleyFX


