


Talking Points:
- This week is heavy with U.S. drivers as there is high-impact data on the calendar for each day Tuesday thru Friday.
- The U.S. Dollar down-trend has continued for another week, and oversold conditions on the Greenback has led to an attractive bullish continuation move in EUR/USD.
- If you’re looking for trade ideas, please check out our Trading Guides. And if you’re looking for shorter-term trade ideas, please check out our IG Client Sentiment.
To receive James Stanley’s Analysis directly via email, please sign up here.
USD Crush Continues –
The big item for this week is the U.S. Dollar. With a Federal Reserve rate decision on the docket for this Wednesday, the bulk of market participants’ attention will likely be there; but it’s the series of U.S. data prints throughout this week that might end up being a bit more telling.
A Busy Week for the U.S. Dollar

Created with the DailyFX Economic Calendar; prepared by James Stanley
The Fed hiked rates in June, but didn’t necessarily roll out any ‘new’ information. The topic of balance sheet reduction was basically punted for a future rate decision, and the Fed continued to say that they’re looking at further hiking rates despite the recent slowdown in U.S. data. But it’s the recent slowdown in U.S. data that seems to have really caught market participants’ eyes, as the U.S. Dollar continues to get crushed in 2017.
Coming into the year, expectations were flying-high for the U.S. economy as the U.S. Dollar marched to fresh 14-year highs. But as data began to print in the New Year, it simply couldn’t keep up with those elevated expectations and this is when U.S. Dollar weakness began to show prominently. At subsequent Fed meetings, the bank continued to say that their opinion on the slowdown in data was that it was a ‘transitory’ development or due to ‘idiosyncratic’ factors. Meanwhile, data in Europe continued to improve; and even with the head of the ECB saying that stimulus exit wasn’t yet on the table, market participants have been re-directing bets on European rate hikes by the end of next year.
This has led to an extended down-trend in the Greenback as the currency has dropped by as much as -9.62% from the 2017 high, which was set on just the second trading day of this year. The Dollar is now trading at one-year lows, levels not seen since last year’s Brexit referendum, and support levels at 93.02 and 91.92 are now exposed on the chart.
U.S. Dollar via ‘DXY’ Running Down to Fresh One-Year Lows

Chart prepared by James Stanley
Given the veracity of the down-trend combined with the fact that little has appeared to bring strength in the Dollar of recent, and it is difficult to yet prognosticate an end to this run. The one bullish factor that currently exists seems to be just how far this has fallen and the fact that sellers are likely going to need additional catalysts to elicit even more supply into a heavily-short market.
At this point – the U.S. Dollar is oversold, and RSI on the four-hour chart has begun to diverge, highlighting how this current bearish run may be getting a bit long-in-the-tooth. On the chart below, we’ve added RSI along with three potential resistance levels to watch for a ‘lower-high’ to develop should these oversold conditions lead to a move-higher.
U.S. Dollar via ‘DXY’ Four-Hour Chart with RSI and Potential Resistance Applied

Chart prepared by James Stanley
Euro Bull Run Continues
Last week was a big one for the Euro, as the European Central Bank rate decision on Thursday propelled another topside move in the single currency. At the press conference following that rate decision, ECB President Mario Draghi echoed a familiarly dovish tone, very similar to what was seen in April and June rate decisions when the head of the bank said that the topic of stimulus exit was not even discussed . In April and June, this dovish comment helped to bring some weakness into the Euro; but last week – no weakness was seen as those comments were ran over by a stampede of bulls attempting to front run what’s starting to feel like an inevitable exit from stimulus later in the year.
That bullish move lasted through Friday and into this week’s open as EUR/USD attempted to break through the 1.1700-handle, but was rebuffed just shy of this level over a couple of different attempts. At 1.1714 we have the 2.5 year high in the pair, and this was set during ‘China’s Black Monday’ on August 24, 2015: If this gets taken-out, there are very few nearby potential resistance levels until we get up to the 1.2000-handle.
EUR/USD into Rarified Air – Above One-Year Highs, Threatening 2.5y Highs at 1.1714

Chart prepared by James Stanley
As the U.S. Dollar is extremely oversold at the moment, EUR/USD is quite overbought. While overbought doesn’t always preclude continued gains, it does make it more difficult to set up and manage risk for momentum and trend continuation strategies. Given the heavy dose of U.S. data on the calendar for this week, we could have a rather accommodating environment to look for a pullback; and on the four-hour chart below, we’ve added three potential support zones that can be watched for such an observation.
EUR/USD Four-Hour Chart with Potential Support Zones Applied
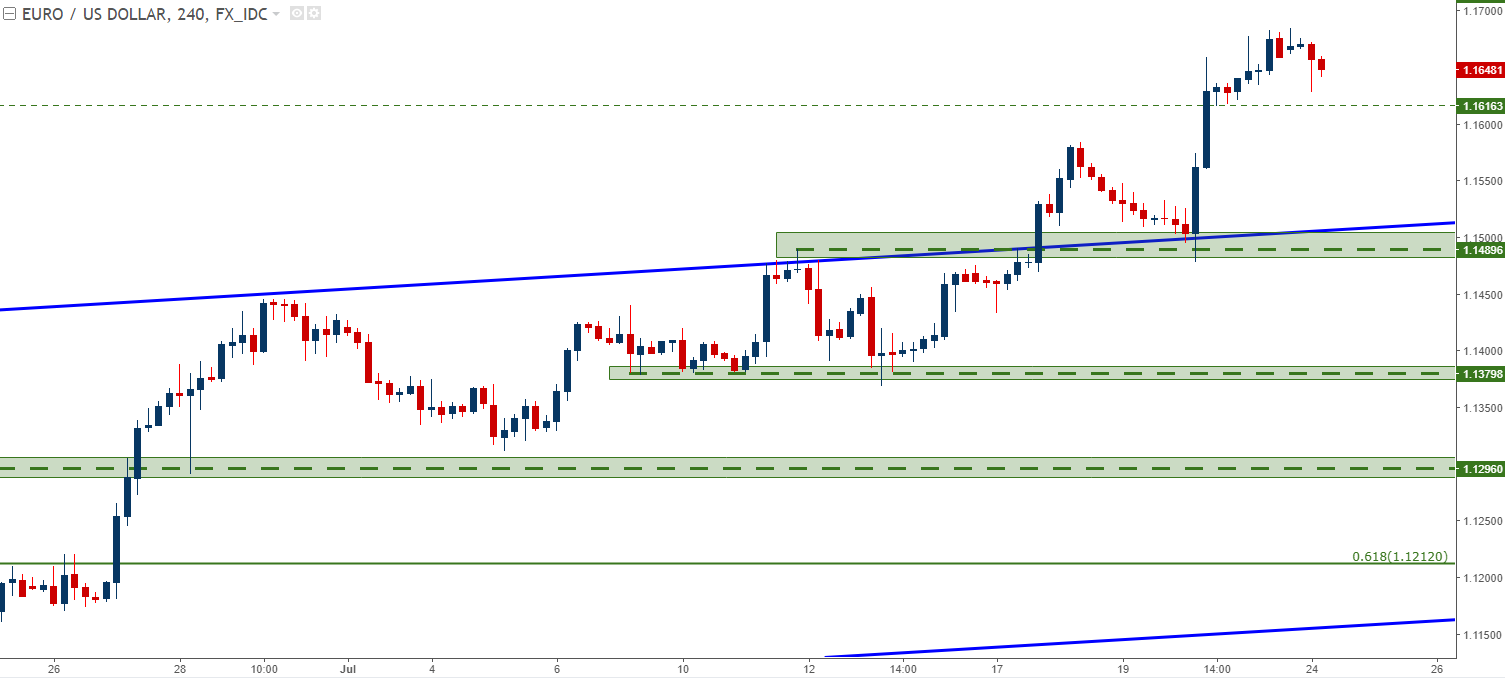
Chart prepared by James Stanley
Cable Correction? – UK GDP on Wed Morning
The British Pound had started to put in bullish tendencies as we came into July. Stronger inflation was driving a shift within the Bank of England, and after the June rate decision saw three dissenting votes for a rate hike in the U.K., the prospect of a stronger currency on the back of higher rate expectations was a very workable theme. But after June inflation disappointed, a bit of pressure was removed from the situation, and GBP/USD fell-below the vaulted 1.3000-level as the prospect of faster inflation forcing the BoE away from loose policy options wasn’t as much of a threat.
This theme comes to light on Wednesday morning as 2nd quarter as U.K. GDP is released for the second quarter. While GDP likely isn’t as strong of a pain point for the BoE at the moment, it is certainly indicative; and this could very much spell the backdrop for which the bank executes that next rate decision. The big number to watch here is .3%. First quarter GDP initially came-in at .3% but was later revised down to .2%. Most estimates for this Wednesday are hovering around .3%; and if we see .4% or more, this will likely elicit a bullish move in Sterling while lower reads of .2% or less will likely bring on bearish price action.
The BoE’s next Super Thursday event is right around the corner, on August 3rd. This will likely be on the front of market participants’ minds as this is the next ‘big’ driver for the U.K., as the Bank of England will be offering updated inflation forecasts which could be a great indicator of just how dovish or hawkish the MPC may be in the periods moving-forward. If we’re going to see a grander shift at the BoE towards ‘less loose’ policy options, it will likely first show up here around the bank’s expectation for forward-looking inflation.
GBP/USD Hourly Chart with Fibonacci Retracement and Bear Flag Applied

Chart prepared by James Stanley
--- Written by James Stanley, Strategist for DailyFX.com
To receive James Stanley’s analysis directly via email, please SIGN UP HERE
Contact and follow James on Twitter: @JStanleyFX


