


Australian Dollar Technical Price Outlook: Near-term Trade Levels
- Australian Dollar technical trade level update – Daily & Intraday Charts
- AUD/USD sell-off attempting to snap six-week losing steak
- Aussie bears vulnerable above weekly open / 2008 low-week close at 6660/66
The Australian Dollar has plummeted more than 4.3% year-to-date against the US Dollar with Aussie testing support at multi-year lows this week. AUD/USD has been in decline for the past six-week sand the immediate short-bias may be vulnerable here near-term. These are the updated targets and invalidation levels that matter on the AUD/USD price charts. Review my latest Weekly Strategy Webinar for an in-depth breakdown of this Aussie trade setup and more.
Australian Dollar Price Chart – AUD/USD Daily
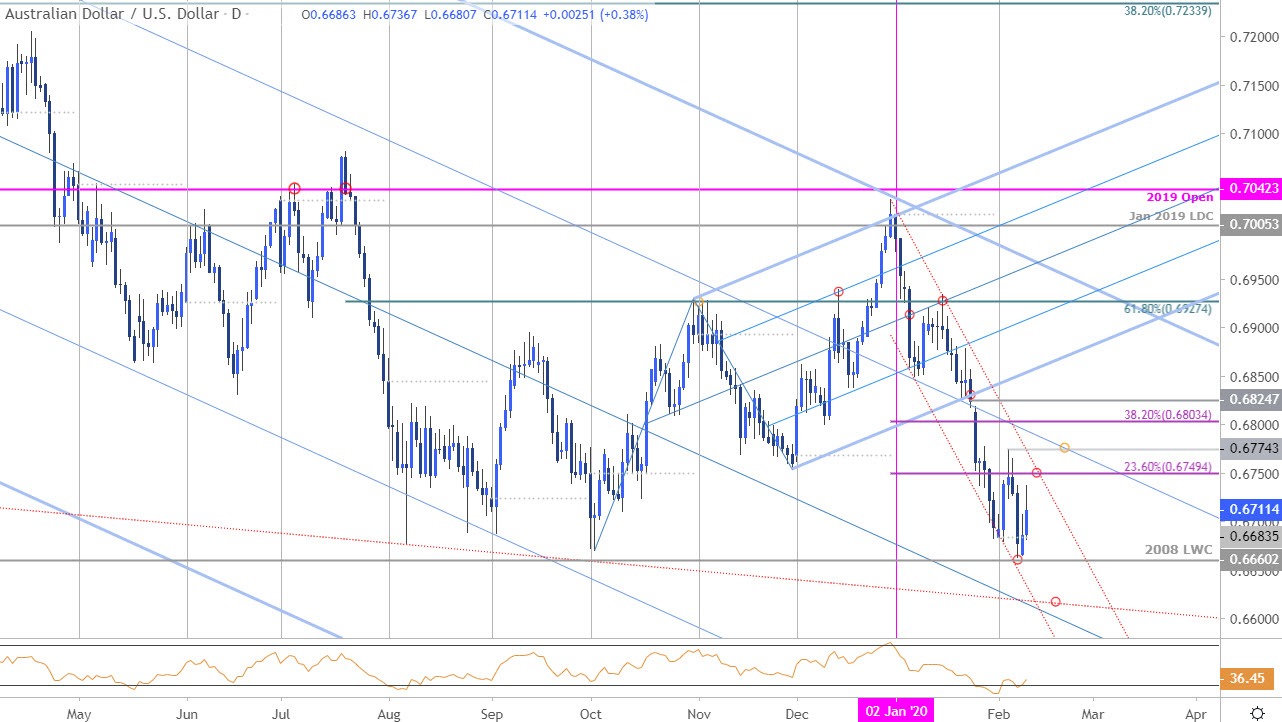
Chart Prepared by Michael Boutros, Technical Strategist; AUD/USD on Tradingview
Technical Outlook: In last month’s Australian Dollar Price Outlook we noted that, “The immediate risk remains lower but we’re looking for downside exhaustion heading into upcoming support objectives ahead of 6800.” Slope support held for three days before gaping lower with the decline registering fresh multi-year lows before turning just ahead of the 2008 low-week close on building divergence. Is AUD/USD basing? Price has continued to trade within the confines of this descending channel formation extending off the December highs and a topside breach / close above will be needed to alleviate further downside pressure in Aussie.
Australian Dollar Price Chart – AUD/USD 240min
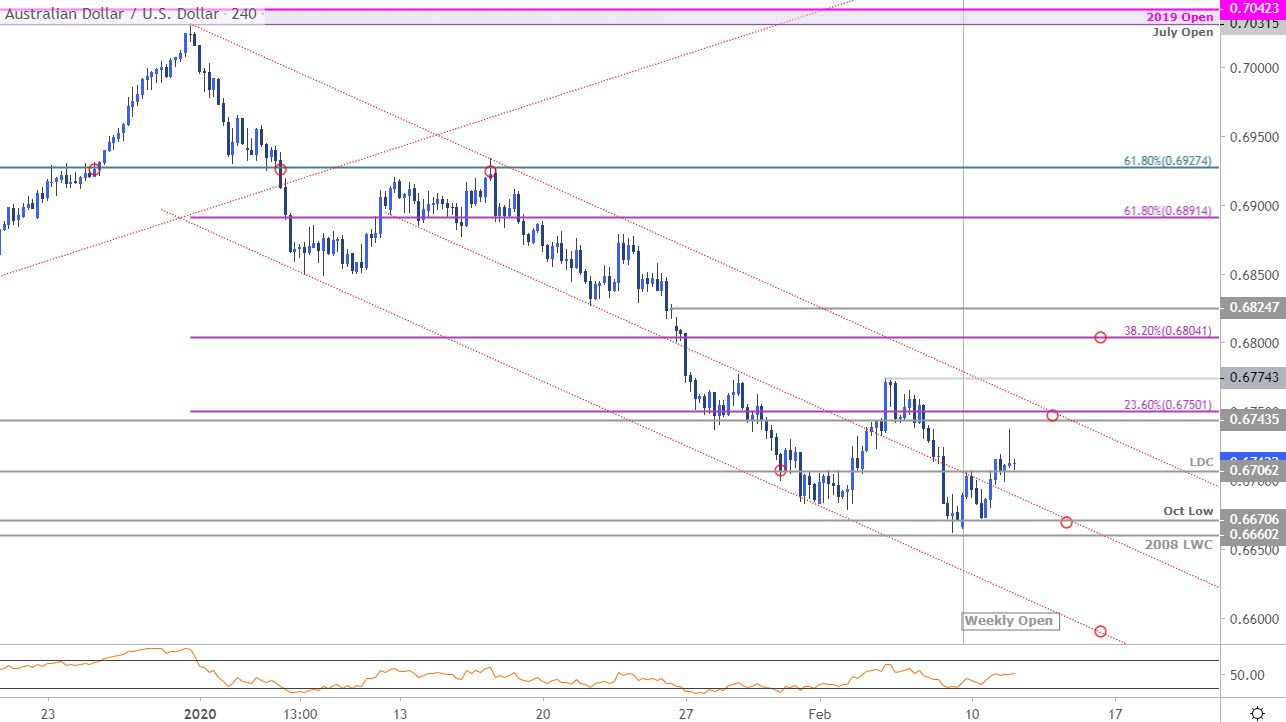
Notes: A closer look at Aussie price action sees AUD/USD rebounding off confluence support at 6660/70 with initial resistance eyed at the 23.6% retracement / January 2018 low / upper parallel at 6744/50- look for a close above the objective February opening-range highs at 6774 to suggest a larger reversal is underway targeting 6804 and the uncovered close at 6825. A break lower from here targets channel support, currently ~6600.

Bottom line: The Australian Dollar is testing support at multi-year lows and leave the immediate short-bias at risk while above 6660. From at trading standpoint, a good place to reduce short-exposure / lower protective stops with a break above this descending formation needed to shift the focus higher. For now, look for a break of the weekly opening-range for guidance. Review my latest Australian Dollar Weekly Price Outlook for a closer look at the longer-term AUD/USD technical trade levels.
For a complete breakdown of Michael’s trading strategy, review his Foundations of Technical Analysis series on Building a Trading Strategy
Australian Dollar Trader Sentiment – AUD/USD Price Chart
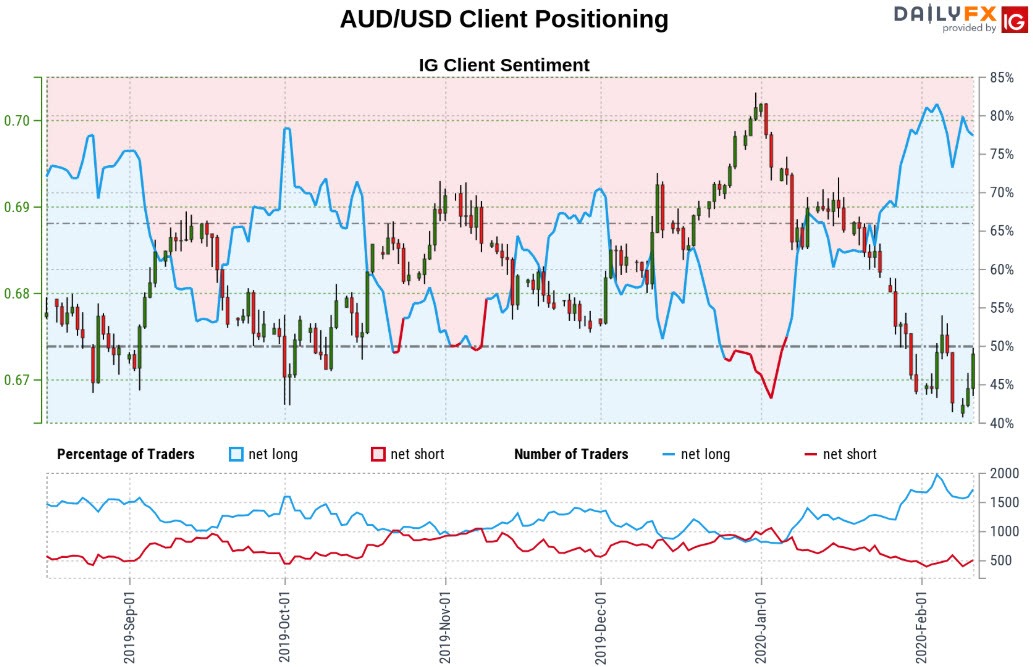
- A summary of IG Client Sentiment shows traders are net-long AUD/USD - the ratio stands at +3.53 (77.95% of traders are long) – bearish reading
- Long positions are 3.60% higher than yesterday and 12.55% lower from last week
- Short positions are15.76% lower than yesterday and 7.61% higher from last week
- We typically take a contrarian view to crowd sentiment, and the fact traders are net-long suggests AUD/USD prices may continue to fall. Traders are more net-long than yesterday but less net-long from last week and the combination of current positioning and recent changes gives us a further mixed AUD/USD trading bias from a sentiment standpoint.
| Change in | Longs | Shorts | OI |
| Daily | -4% | 13% | 3% |
| Weekly | 26% | 1% | 13% |
---
Key Australia / US Data Releases
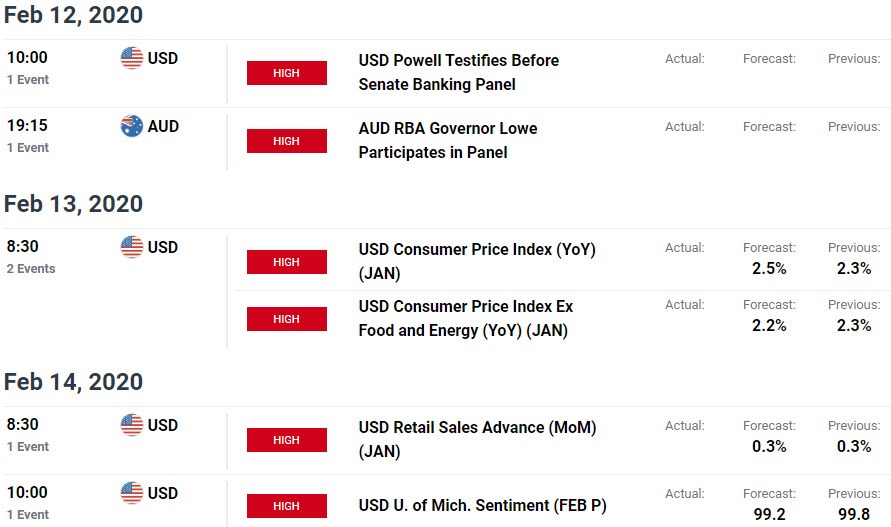
Economic Calendar - latest economic developments and upcoming event risk.
Active Trade Setups
- Gold Price Outlook: XAU/USD Bulls Eye Trend Resistance- GLD Levels
- Canadian Dollar Price Outlook: USD/CAD Breakout Testing Resistance
- Sterling Price Outlook: British Pound Slams into Key GBP/USD Support
- S&P 500 Price Outlook: SPX500 Rally Targets Fresh Yearly Highs
- Bitcoin Price Outlook: BTC/USD Rally Falters- Crypto Trade Levels
- Mexican Peso Price Outlook: USD/MXN in Consolidation- Breakout Levels
- Written by Michael Boutros, Currency Strategist with DailyFX
Follow Michael on Twitter @MBForex


