
GBP/USD and FTSE100 Analysis and Charts
- UK economy ‘going gangbusters’ – Office for National Statistics.
- Sterling underpinned, FTSE 100 continues to print record highs.

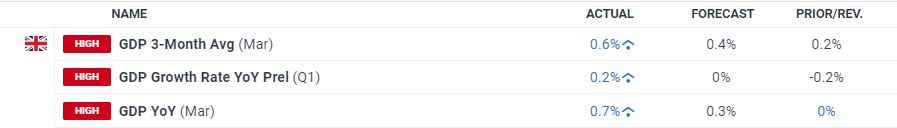
The UK economy grew by 0.6% in the first quarter of the year, driven by a 0.7% increase in services output, beating analysts’ forecasts and ending the technical recession seen last year. Nominal GDP is estimated to have grown by 1.2% in Q1. According to ONS chief economist Grant Fitzner, ‘ to paraphrase the former Australian Prime Minister Paul Keating, you could say the economy is going gangbusters.’
For all market-moving economic data and events, see the DailyFX Economic Calendar
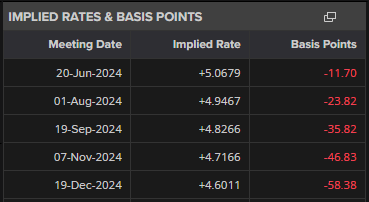
Interest rate cut expectations were pared back marginally post-data. The first 25 basis point BoE cut is seen in August, although the June meeting remains a live event, with the second cut forecast for November.
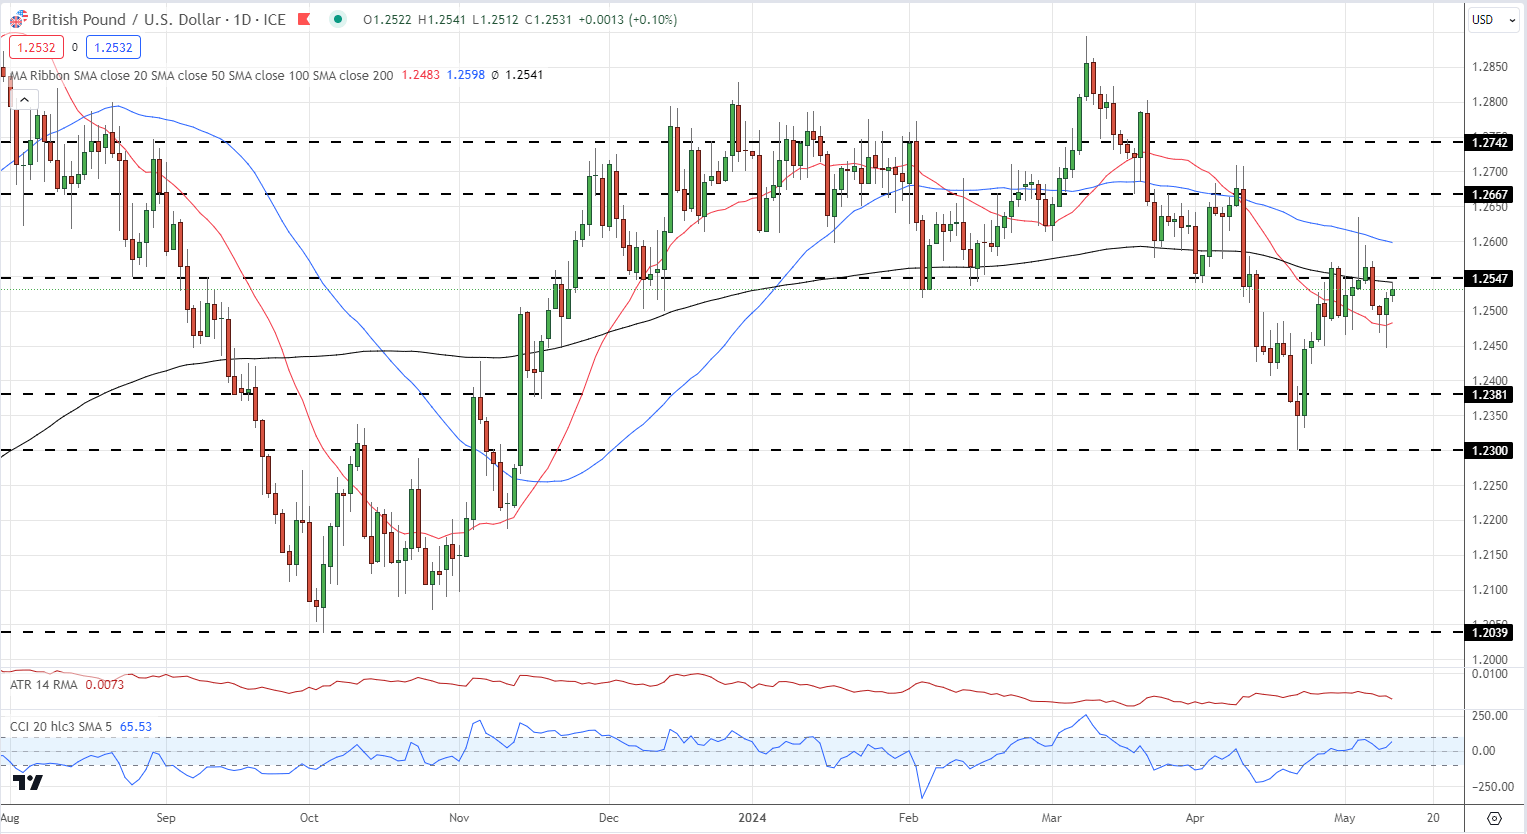
Cable (GBP/USD) moved slightly higher after the data release, helped in part by a weak US dollar. The 200-day simple moving average (1.2541) is now blocking a further higher and unless US data out later today weakens the greenback further, short-term cable upside may be limited.
GBP/USD Daily Price Chart
IG Retail data shows 57.48% of traders are net-long with the ratio of traders long to short at 1.35 to 1.The number of traders net-long is 9.60% lower than yesterday and 19.72% higher than last week, while the number of traders net-short is 2.23% higher than yesterday and 13.42% lower than last week.
We typically take a contrarian view to crowd sentiment, and the fact traders are net-long suggests GBP/USD prices may continue to fall.
Download the Full Guide to See How Changes in IG Client Sentiment Can Help Your Trading Decisions
| Change in | Longs | Shorts | OI |
| Daily | 13% | 7% | 9% |
| Weekly | -18% | 24% | 3% |
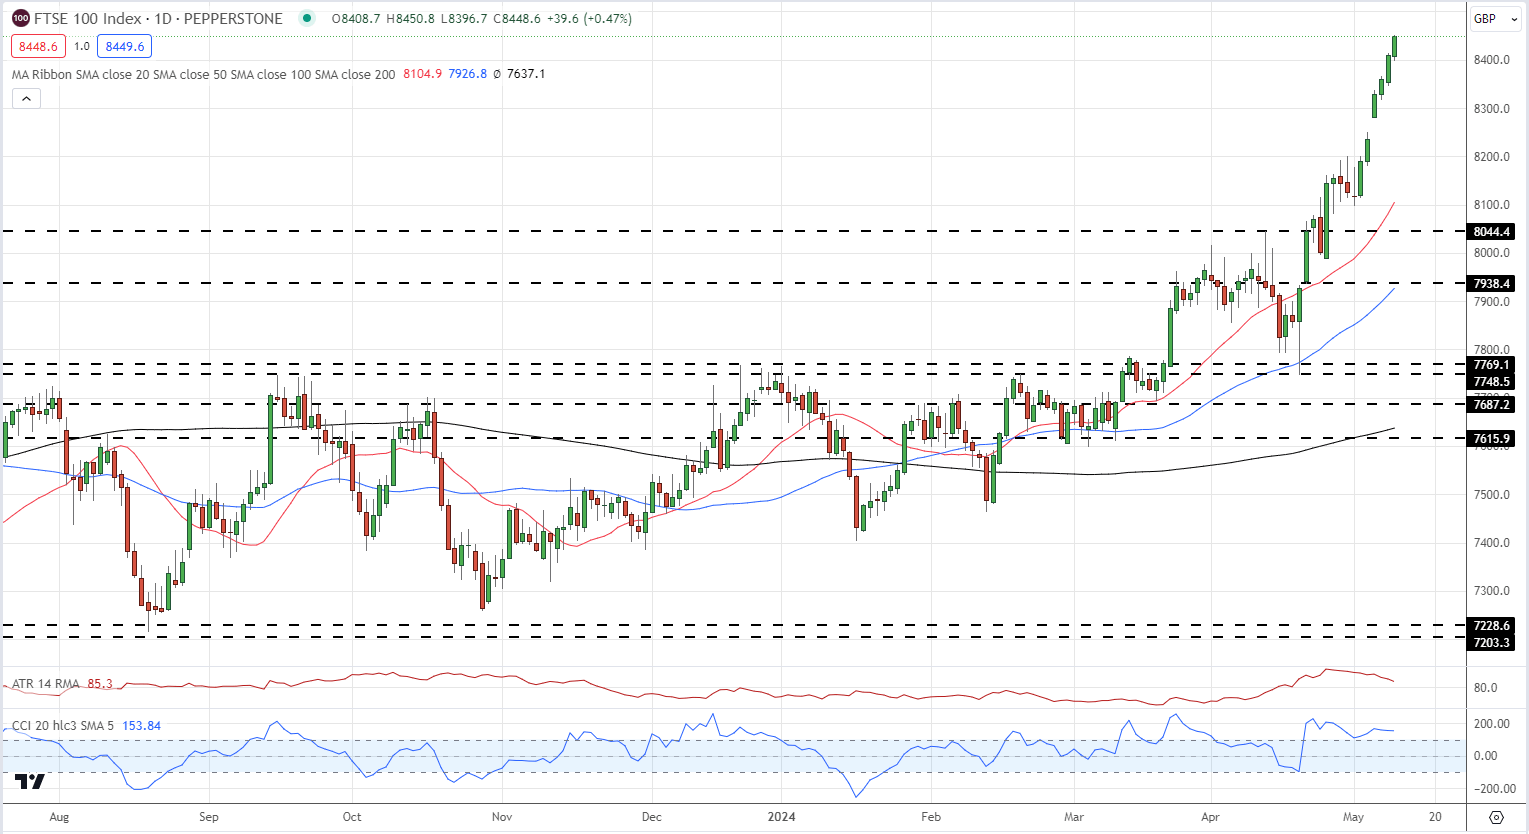
The FTSE 100 continues to post fresh all-time highs, with today’s GDP data sending the UK big board through the 8,400 barrier. The ongoing re-rating of the FTSE 100, and increased M&A activity has seen the index surge by around 1,000 points off this year’s low. Six green candles in a row underscore this week’s rally. Going into the weekend, the index may slow, but with UK economic confidence growing further, the outlook remains positive.
FTSE Daily Price Chart
What is your view on the British Pound and the FTSE 100 – bullish or bearish?? You can let us know via the form at the end of this piece or you can contact the author via Twitter @nickcawley1.