
Most Read: EUR/USD, USD/JPY, GBP/USD – Technical Analysis and Price Outlook
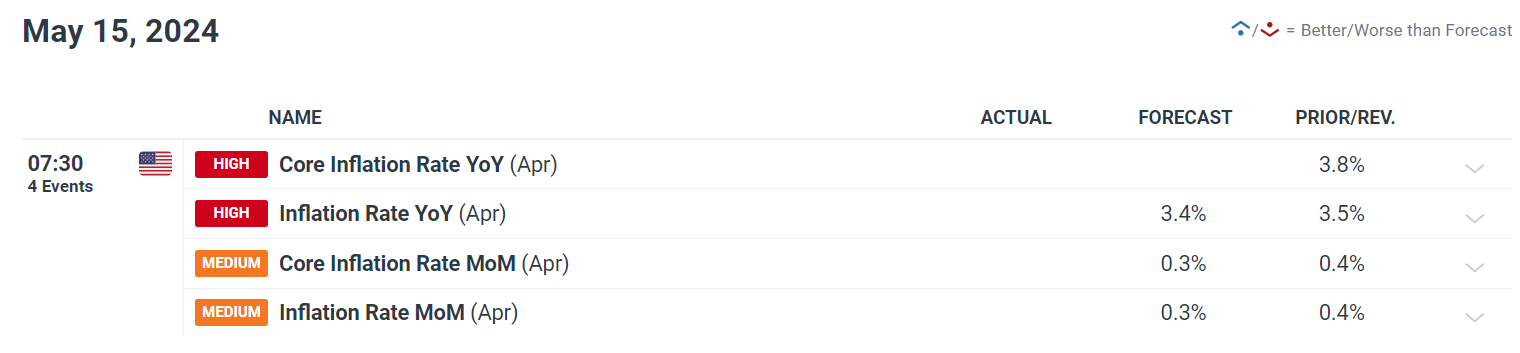
The U.S. dollar asserted its strength on Friday, riding on higher U.S. Treasury yields in anticipation of next week's highly awaited U.S. consumer price index data. Investors are closely watching the CPI figures, as they could guide the Fed’s next step in terms of monetary policy. That said, a hot CPI report could spark a hawkish repricing of interest rate expectations, further boosting the greenback. Conversely, softer-than-anticipated numbers could dampen the dollar's strength by rekindling hopes for early rate cuts.
Putting fundamentals aside now, the next section of this article will focus on analyzing the technical outlook for three U.S. dollar pairs: EUR/USD, USD/JPY and GBP/USD. Here we will take an in-depth look at important price thresholds that can serve as support or resistance in the coming days. These levels can not only provide valuable information for risk management, but also play a crucial role in strategic decision making when establishing positions in the currency market.
Want to know where EUR/USD is headed over the coming months? Explore all the insights available in our second-quarter forecast. Request your complimentary guide today!

EUR/USD FORECAST - TECHNICAL ANALYSIS
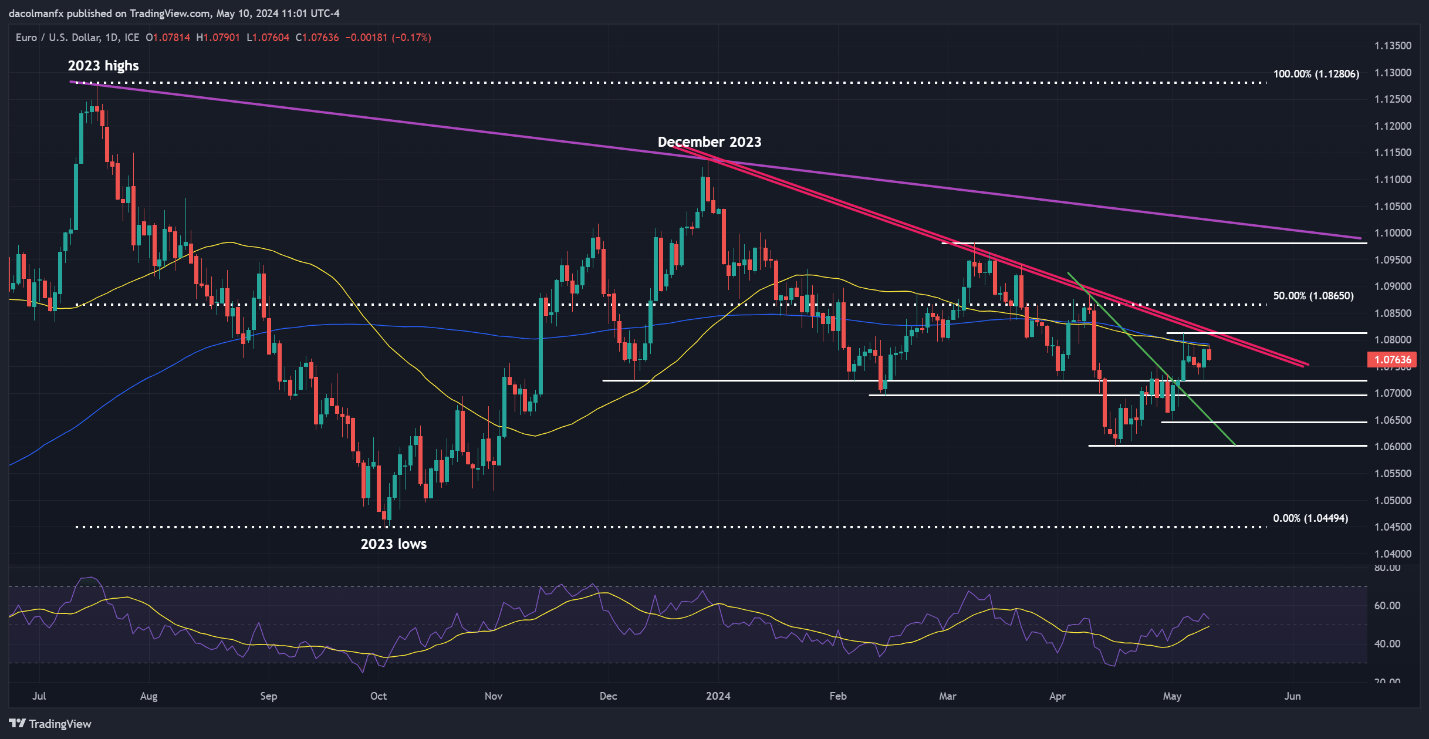
EUR/USD declined on Friday following an unsuccessful attempt to surpass its 50-day and 200-day simple moving averages at 1.0790, a robust technical barrier, causing the exchange rate to dip towards 1.0750. If the pullback gathers traction in the coming days, support awaits at 1.0725, followed by 1.0695. Further downside movement could lead to a retreat towards 1.0645.
In the scenario of a bullish reversal, the first hurdle on the upward journey emerges at 1.0790. Breaching this ceiling might pose a challenge, yet upon a successful breakout, the pair could potentially rally towards trendline resistance at 1.0810. Upside progress beyond this region could open the door to move towards a key Fibonacci level at 1.0865.
EUR/USD PRICE ACTION CHART
EUR/USD Chart Created Using TradingView
Wondering about the yen's prospects – will it continue to weaken or mount a bullish comeback? Discover all the details in our Q2 forecast. Don't miss out – request your free guide today!

USD/JPY FORECAST - TECHNICAL ANALYSIS
USD/JPY rose on Friday, tentatively approaching the 156.00 mark. If gains continue in the coming trading sessions, resistance looms at 158.00, followed by 160.00. Traders need to approach any upward movement towards these levels cautiously, refraining from blinding riding with momentum, given the risk of Tokyo intervening in the FX space to prop up the yen, which could quickly send the pair tumbling.
Conversely, if sellers return and prices start heading lower, the first support to monitor materializes at 154.65, followed by 153.15. Additional losses below this point may boost bearish impetus, creating the perfect environment for a drop towards trendline support and the 50-day simple moving located slightly above the 152.00 handle.
USD/JPY PRICE ACTION CHART

USD/JPY Chart Created Using TradingView
Interested in learning how retail positioning can offer clues about GBP/USD’s directional bias? Our sentiment guide contains valuable insights into market psychology as a trend indicator. Request a free copy now!
| Change in | Longs | Shorts | OI |
| Daily | 14% | 7% | 10% |
| Weekly | -16% | 21% | 3% |
GBP/USD FORECAST - TECHNICAL ANALYSIS
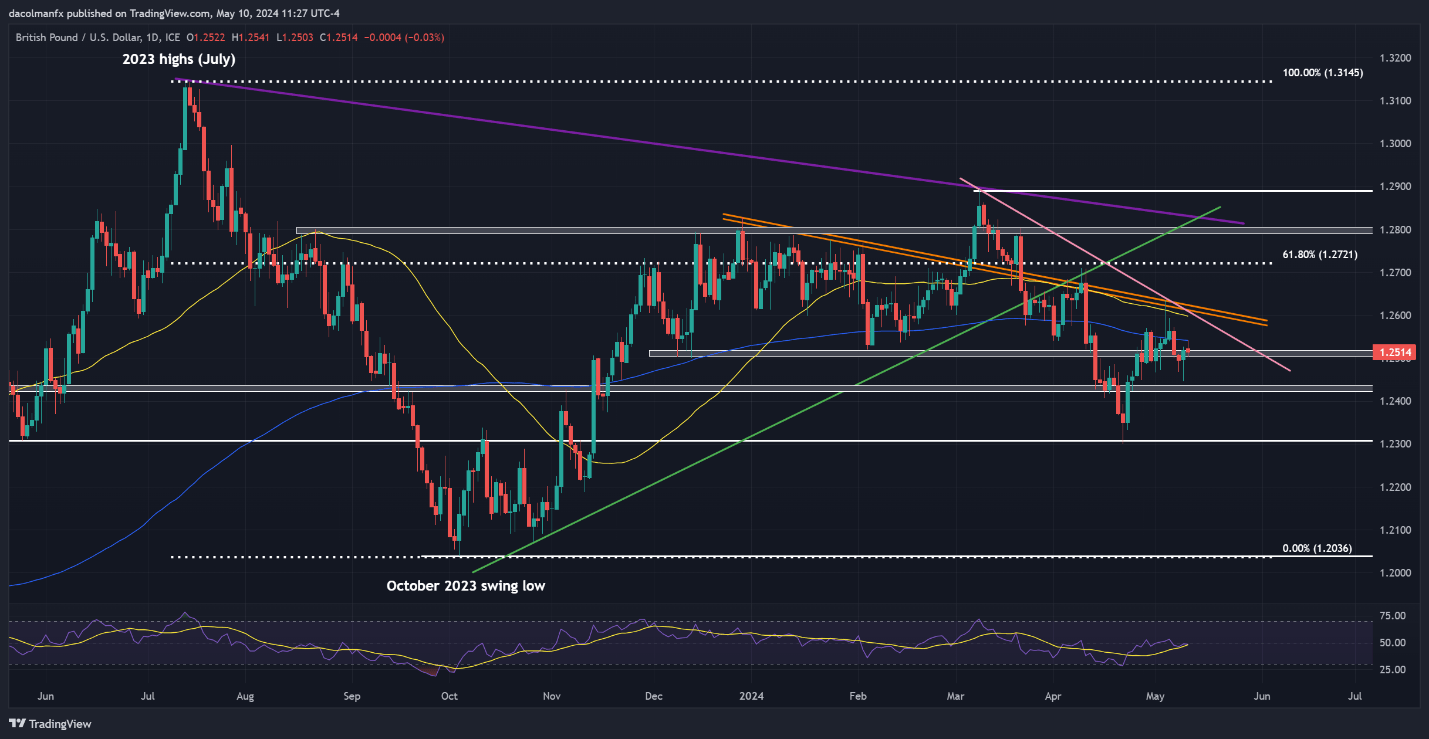
GBP/USD dipped slightly on Friday but held firm above the 1.2500 mark. Bulls must vigorously defend this technical floor; any failure to do so might precipitate a decline toward 1.2430. Although prices could stabilize around this region before a potential rebound, a breakdown could pave the way for a descent toward April's low at 1.2300.
On the other hand, if buyers mount a comeback and propel prices above the 200-day SMA, confluence resistance spans from 1.2600 to 1.2630, an area that marks the convergence of the 50-day simple moving average with two significant trendlines. Taking out this barrier could inject optimism into the market, fueling further gains for the pound and potentially leading to a move towards 1.2720.
GBP/USD PRICE ACTION CHART