


- USD/JPY reverses off key resistance- breakdown at initial support into monthly open at 107.71
- Check out our 2019 projections in our Free DailyFX USD/JPY Trading Forecasts
- Join Michael for Live Weekly Strategy Webinars on Mondays at 12:30GMT
The Japanese Yen rallied more than 1.7% against the US Dollar from the December highs in USD/JPY with price reversing off a critical resistance barrier we’ve been tracking for months now. These are the updated targets and invalidation levels that matter on the USD/JPY weekly price chart heading into the start of January trade. Review my latest Weekly Strategy Webinar for an in-depth breakdown of this gold price setup and more.

Japanese Yen Price Chart – USD/JPY Weekly
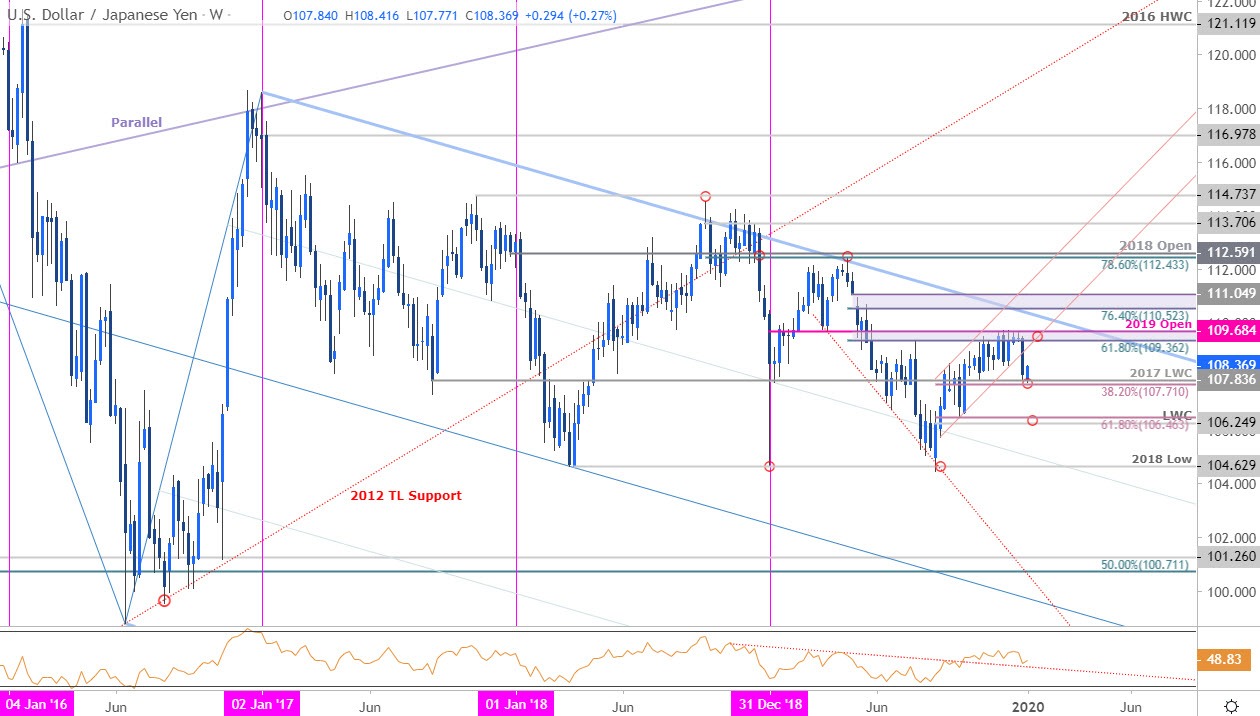
Chart Prepared by Michael Boutros, Technical Strategist; USD/JPY on Tradingview
Notes: In our last Japanese Yen Weekly Price Outlook we noted that USD/JPY was, “testing critical yearly open resistance at 109.68 and we’re looking for a reaction.” Price held below this key threshold for six-consecutive weeks before breaking up-channel support last week with the pullback now testing the first major support target at 107.71/84- a region defined by the 38.2% retracement of the late-August advance and the 2017 low- week close.
The immediate decline is vulnerable while above this threshold with a break / close below needed to mark resumption targeting he 61.8% retracement / 2019 low-week close at 106.25/46. Resistance steady at 109.36/68 with a breach there exposing pitchfork resistance extending off the 2017 highs, currently around ~110.30s.

For a complete breakdown of Michael’s trading strategy, review his Foundations of Technical Analysis series on Building a Trading Strategy
Bottom line: The USD/JPY breakdown is testing the first major support zone into the start of the year at 107.71/84- look for a reaction here early in the month with the broader risk lower sub-109.36 heading into January trade. From a trading standpoint, looking for topside exhaustion on a recovery to offer more favorable entries for a move lower. I’ll publish an updated Japanese Yen Price Outlook once we get further clarity on the near-term USD/JPY technical trade levels.
Japanese Yen Trader Sentiment – USD/JPY Price Chart
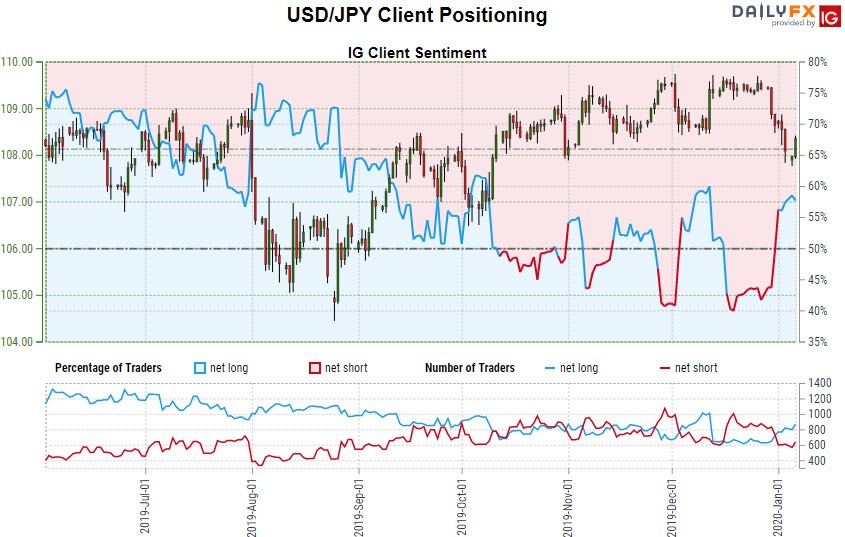
- A summary of IG Client Sentiment shows traders are net-long USD/JPY - the ratio stands at +1.20 (54.57% of traders are long) – weak bearish reading
- Long positions are12.42% higher than yesterday and 37.63% higher from last week
- Short positions are 31.80% higher than yesterday and 5.09% lower from last week
- We typically take a contrarian view to crowd sentiment, and the fact traders are net-long suggests USD/JPY prices may continue to fall. Yet traders are less net-long than yesterday but more net-long from last week and the combination of current positioning and recent changes gives us a further mixed USD/JPY trading bias from a sentiment standpoint.
| Change in | Longs | Shorts | OI |
| Daily | -2% | 2% | 0% |
| Weekly | 12% | -16% | -6% |
---
Previous Weekly Technical Charts
- Sterling (GBP/USD)
- Gold (XAU/USD)
- US Dollar Index (DXY)
- Euro (EUR/USD)
- Canadian Dollar (USD/CAD)
- Australian Dollar (AUD/USD)
- Crude Oil (WTI)

--- Written by Michael Boutros, Technical Currency Strategist with DailyFX
Follow Michael on Twitter @MBForex


