


- US Dollar testing major uptrend support- risk is lower sub-98.84
- Check out our 2019 projections in our Free DailyFX USD Trading Forecasts
- Join Michael for Live Weekly Strategy Webinars on Mondays at 12:30GMT
The US Dollar is testing major uptrend support after reversing sharply off multi-year slope resistance. While the broader exhaustion trade remains in focus, the immediate decline may see some interruptions here. These are the updated targets and invalidation levels that matter on the DXY weekly price chart. Review my latest Weekly Strategy Webinar for an in-depth breakdown of this Loonie price setup and more.
New to Forex Trading? Get started with this Free Beginners Guide
US Dollar Price Chart – DXY Weekly
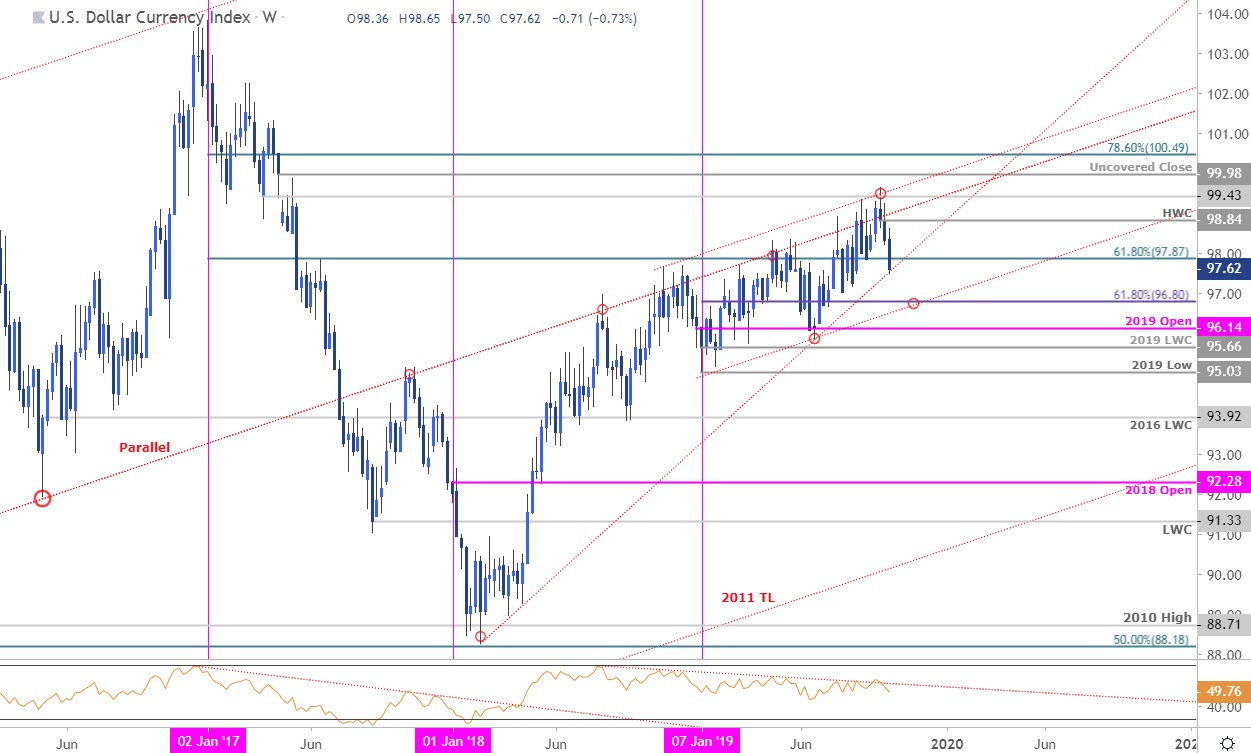
Chart Prepared by Michael Boutros, Technical Strategist; DXY on Tradingview
Notes: In my last USD Price Outlook we noted to, “Be on the lookout for possible topside exhaustion into this slope extending off the 2018 high with a weekly close above needed to fuel the next leg higher in price.” DXY attempted to breach this trendline early in the month before reversing sharply with the index falling more than 1.8% off the highs. Note that weekly momentum also failed to hold a break above a resistance trigger we’ve been tracking for over a year- further highlighting the downside risk to the greenback.
That said, the decline is now testing a multi-year trendline dating back t the 2018 lows- a break / close below this slope is needed to keep the short-bias viable with such a scenario targeting confluence support at the 61.8% retracement of the yearly range / slope support at 96.80. Look for a bigger reaction there if reached. Initial weekly resistance stands at 98.35 backed by the high-week reversal-close at 98.84- price should not exceed this threshold IF the dollar is indeed heading lower.
For a complete breakdown of Michael’s trading strategy, review his Foundations of Technical Analysis series on Building a Trading Strategy
Bottom line: The US Dollar turned from BIG resistance this month with the decline now testing multi-year slope support. From at trading standpoint, a good spot to reduce short-exposure / lower protective stops – look for exhaustion on a recovery while below the high-week close with a break lower likely to fuel accelerated losses in the greenback. I’ll publish an updated DXY Price Outlook once we get further clarity on the near-term DXY technical trading levels.
---
Latest Weekly Technical Charts
- New Zealand Dollar (NZD/USD)
- Canadian Dollar (USD/CAD)
- Sterling (GBP/USD)
- Gold (XAU/USD)
- Silver (XAG/USD)
- Euro (EUR/USD)
- Crude Oil (WTI)
Learn how to Trade with Confidence in our Free Trading Guide
--- Written by Michael Boutros, Technical Currency Strategist with DailyFX
Follow Michael on Twitter @MBForex


