


- NZD/USD rebounds ahead of long-term techncial support- shorts at risk above 62
- Check out our 2019 projections in our Free DailyFX USD Trading Forecasts
- Join Michael for Live Weekly Strategy Webinars on Mondays at 12:30GMT
The New Zealand Dollar is on the defensive early in the week with Kiwi down more than 0.8% against the US Dollar. The decline takes price within 0.9% of the yearly lows and major technical support and while the broader outlook remains tilted to the downside, the immediate decline remains vulnerable into this region. These are the updated targets and invalidation levels that matter on the NZD/USD weekly chart. Review my latest Weekly Strategy Webinar for an in-depth breakdown of this Loonie price setup and more.
New to Forex Trading? Get started with this Free Beginners Guide
New Zealand Dollar Price Chart – NZD/USD Weekly
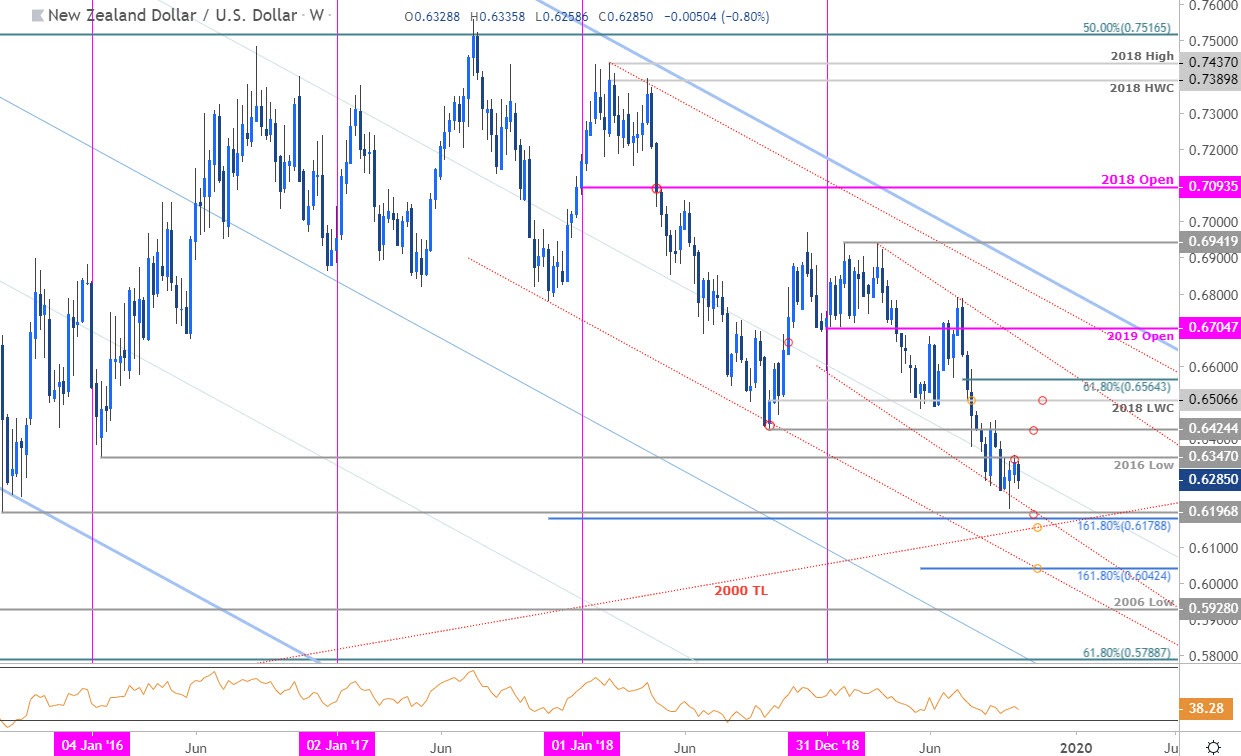
Chart Prepared by Michael Boutros, Technical Strategist; NZD/USD on Tradingview
Notes: The New Zealand Dollar has been trading within the confines of a descending channel formation extending off the March high with price rebounding off the lower parallel on building momentum divergence late-last month. The turn came just pips from a key support confluence at 6179/97 – a region defined by the 1.618% extension of the 2017 decline and the 2015 swing low. This threshold is backed closely by a longer-term trendline extending off the 2000 / 2009 swing lows, currently around ~6160s.
So, was last month’s low a more significant reversal? If it was, pullbacks in price should be short-lived. Look for initial weekly resistance at the 2016 swing-low at 6347 backed by 6424 and the 2018 low-week close at 6506- expect a bigger reaction there if reached.
For a complete breakdown of Michael’s trading strategy, review his Foundations of Technical Analysis series on Building a Trading Strategy
Bottom line: The broader short-bias in NZD/USD is at risk while above key confluence support just below the 62-handle. From a trading standpoint, a good place to reduce short-exposure / lower protective stops – be on the lookout for downside exhaustion on pullbacks while above the low-close at 6257. A downside break / close below this support structure would likely see accelerated losses with such a scenario exposing initial targets at 6042. I’ll publish an update New Zealand Dollar Price Outlook once we get further clarity on the near-term NZD/USD technical trade levels.
New Zealand Dollar Trader Sentiment – NZD/USD Price Chart

- A summary of IG Client Sentiment shows traders are net-long NZD/USD - the ratio stands at -3.59 (78.08% of traders are long) – bearish reading
- Long positions are3.58% lower than yesterday and 9.80% higher from last week
- Short positions are 2.72% higher than yesterday and 20.53% lower from last week
- We typically take a contrarian view to crowd sentiment, and the fact traders are net-long suggests NZD/USD prices may continue to fall. Yet traders are less net-long than yesterday but more net-long from last week and the combination of current positioning and recent changes gives us a further mixed NZD/USD trading bias from a sentiment standpoint.
See how shifts in NZD/USD retail positioning are impacting trend- Learn more about sentiment!
---
Latest Weekly Technical Charts
- Canadian Dollar (USD/CAD)
- Sterling (GBP/USD)
- Gold (XAU/USD)
- Silver (XAG/USD)
- Euro (EUR/USD)
- Crude Oil (WTI)
- Japanese Yen (USD/JPY)
Learn how to Trade with Confidence in our Free Trading Guide
--- Written by Michael Boutros, Technical Currency Strategist with DailyFX
Follow Michael on Twitter @MBForex


