


- British Pound T now targeting initial test of trend resistance- 1.2374-1.2433 Critical
- Check out our 2019 projections in our Free DailyFX GBP/USD Trading Forecasts
- Join Michael for Live Weekly Strategy Webinars on Mondays at 12:30GMT
Sterling surged this week with the British Pound rallying more than 2.7% against the US Dollar to trade at 1.2660 ahead of the New York close on Friday. The rally marks the largest single-week advance since September of 2017 and takes price into a critical resistance zone at trend extremes. These are the updated targets and invalidation levels that matter on the GBP/USD weekly price chart. Review my latestWeekly Strategy Webinar for an in-depth breakdown of this Sterling price setup and more.
New to Forex Trading? Get started with this Free Beginners Guide
Sterling Price Chart - GBP/USD Weekly
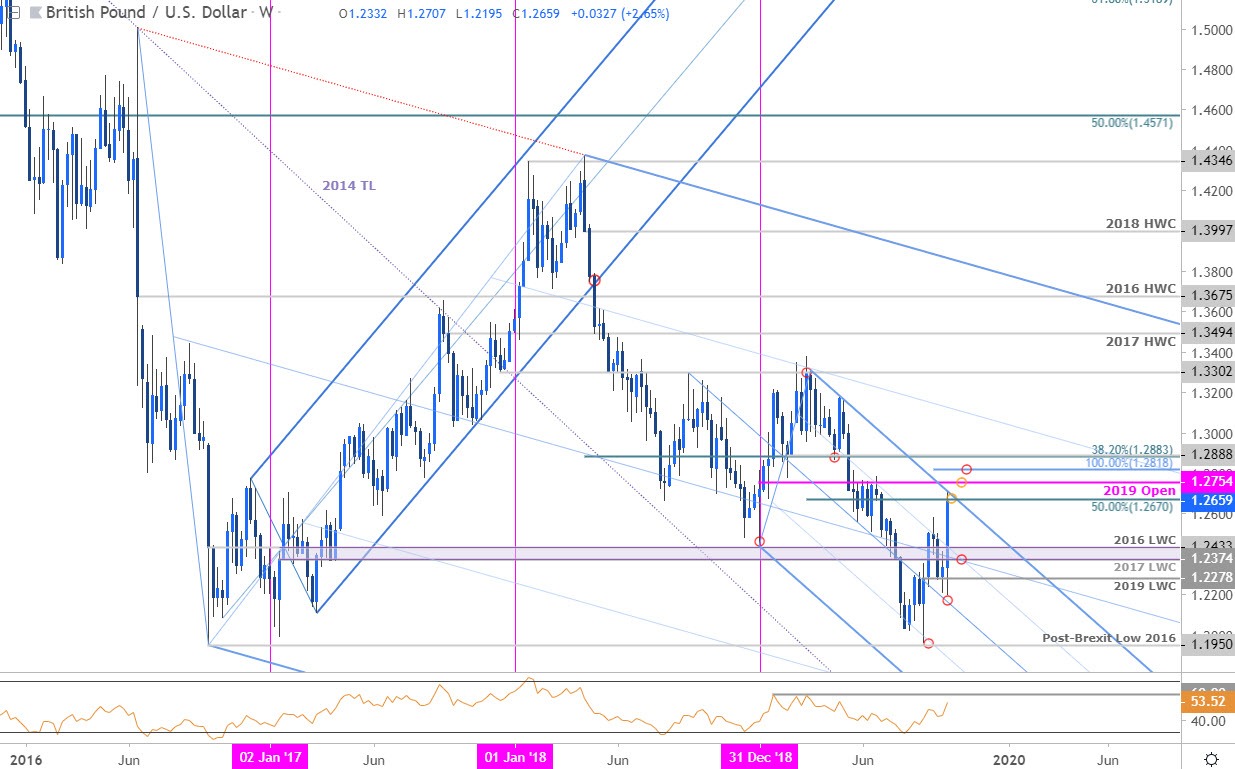
Chart Prepared by Michael Boutros, Technical Strategist; GBP/USD on Tradingview
Notes:Sterling posted a 4.2% range this week with price reversing off the median-line of a the descending pitchfork formation we’ve been tracking off the late-2018 / 2019 highs. The rally is now testing the upper parallel / 50% retracement around ~1.2670/90 and a breach / close above this threshold is needed to validate a larger breakout in the British Pound.
Subsequent topside resistance objectives are stacked just higher at the yearly open at 1.2754, the 100% extension at 1.2818 and the 38.2% retracement of the 2018 decline at 1.2883. Interim support now rests at the 2017 low-week close at 1.2374 backed closely by near-term bullish invalidation at the September low-week close at 1.2278.
For a complete breakdown of Michael’s trading strategy, review his Foundations of Technical Analysis series on Building a Trading Strategy
Bottom line:Sterling is testing BIG downtrend resistance here and the focus is on a breach of this key technical resistance confluence. From at trading standpoint, the immediate advance may be vulnerable here, but the broader focus remains higher while above 1.2278. From a trading standpoint a good spot to reduce long-exposure / raise protective stops – we’ll favor fading weakness while above the low-week close targeting a topside breach / breakout of this formation. I’ll publish an updated Sterling Price Outlook once we get further clarity on the near-term GBP/USD technical trade levels.
Sterling Trader Sentiment (GBP/USD)
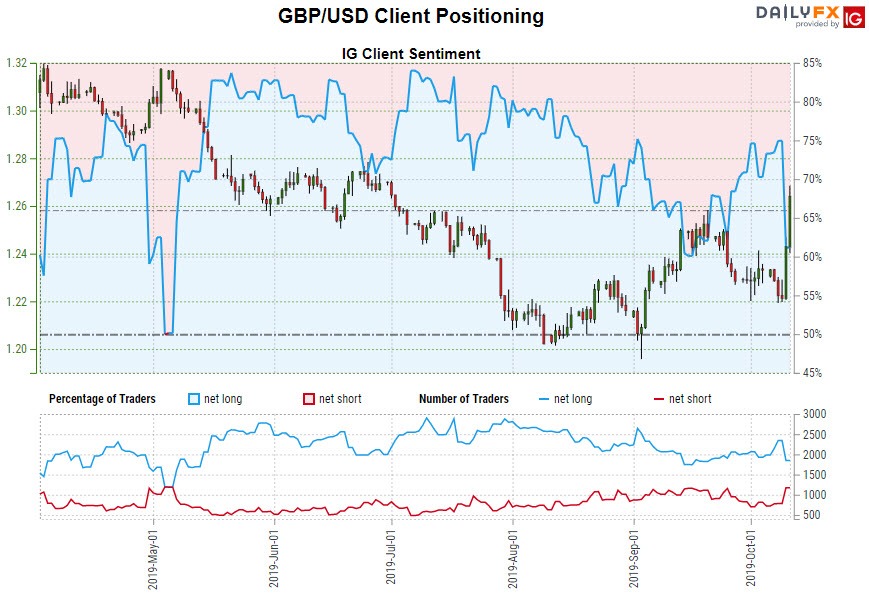
- A summary of IG Client Sentiment shows traders are net-long GBP/USD - the ratio stands at +1.64 (62.16% of traders are long) – bearish reading
- Long positions are22.55% lower than yesterday and 17.64% lower from last week
- Short positions are 26.52% higher than yesterday and 29.39% higher from last week
- We typically take a contrarian view to crowd sentiment, and the fact traders are net-long suggests GBP/USD prices may continue to fall. Yet traders are less net-long than yesterday and compared with last week. Recent changes in sentiment warn that the current GBP/USD price trend may soon reverse higher despite the fact traders remain net-long.
See how shifts in GBP/USD retail positioning are impacting trend- Learn more about sentiment!
---
Previous Weekly Technical Charts
- Gold (XAU/USD)
- Silver (XAG/USD)
- Euro (EUR/USD)
- Crude Oil (WTI)
- Japanese Yen (USD/JPY)
- Canadian Dollar (USD/CAD)
- US Dollar Index (DXY)
Learn how to Trade with Confidence in our Free Trading Guide
--- Written by Michael Boutros, Technical Currency Strategist with DailyFX
Follow Michael on Twitter @MBForex


