


- USD/JPY reverses off downtrend resistance- risk for further losses sub-108.18
- Check out our 2019 projections in our Free DailyFX USD/JPY Trading Forecasts
- Join Michael for Live Weekly Strategy Webinars on Mondays at 12:30GMT
The Japanese Yen marked a three-day losing streak against the US Dollar yesterday with price down more than 1% this week. USD/JPY posted a range of more than 1.6% off the weekly highs with a reversal pattern off key technical resistance threatening further losses. These are the updated targets and invalidation levels that matter on the USD/JPY price charts this week.
New to Forex Trading? Get started with this Free Beginners Guide
Japanese Yen Price Chart – USD/JPY Weekly

Chart Prepared by Michael Boutros, Technical Strategist; USD/CAD on Tradingview
Notes: In my last Japanese Yen Price Outlook we noted that, “The recent reversal pattern off downtrend resistance risks further losses for USD/JPY while below 108.18.” Price fell more than 0.9% in the following days to register a low at 106.48 before rebounding post-NFPs on Friday. This week’s decline is poised to mark an outside weekly-reversal off confluence resistance and keeps the risk weighted to the downside in USD/JPY.
Key support rests at 105.99-106.25- a region defined by the 61.8% retracement of the august advance and the yearly low-week reversal close. A close / break below this threshold is needed to mark resumption of the broader downtrend targeting the 2018 lows at 104.63. Resistance steady at 108.42 with broader bearish invalidation at 109.36/68 (critical).
For a complete breakdown of Michael’s trading strategy, review his Foundations of Technical Analysis series on Building a Trading Strategy
Bottom line: USD/JPY is poised to set an outside weekly reversal off slope resistance – we’re coming into near-term downtrend support here, but the risk remains lower. From a trading standpoint, look to fade strength next week for a more significant reaction on a deeper stretch towards 106 IF reached. Review my latest Japanese Yen Price Outlook for a closer look at the near-term USD/JPY technical trading levels.
Japanese Yen Trader Sentiment - USD/JPY Price Chart
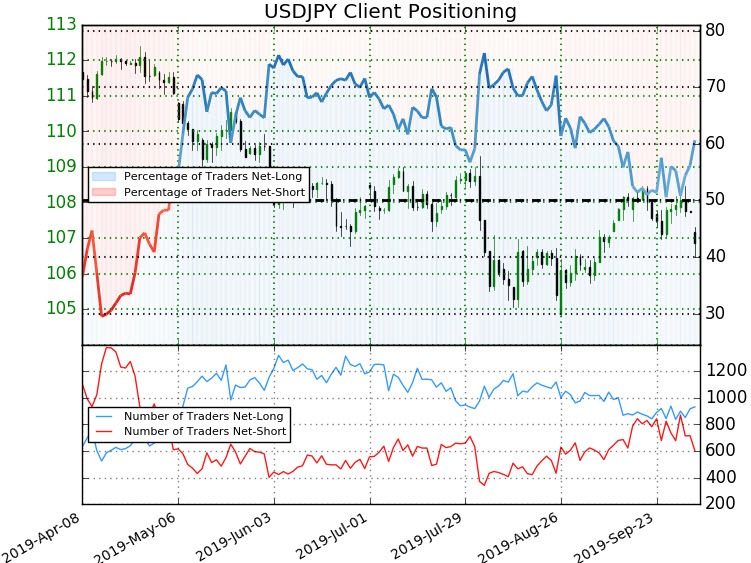
- A summary of IG Client Sentiment shows traders are net-long USD/JPY - the ratio stands at +1.34 (57.20% of traders are long) – weak bearish reading
- Long positions are 4.14% lower than yesterday and 6.57% higher from last week
- Short positions are 2.02% lower than yesterday and 4.15% higher from last week
- We typically take a contrarian view to crowd sentiment, and the fact traders are net-long suggests USD/JPY prices may continue to fall. Traders are less net-long than yesterday but more net-long from last week andthe combination of current positioning and recent changes gives us a further mixed USD/JPY trading bias from a sentiment standpoint.
See how shifts in USD/JPY retail positioning are impacting trend- Learn more about sentiment!
---
Previous Weekly Technical Charts
- Canadian Dollar (USD/CAD)
- US Dollar Index (DXY)
- Australian Dollar (AUD/USD)
- Gold (XAU/USD)
- Crude Oil (WTI)
- Euro (EUR/USD)
Learn how to Trade with Confidence in our Free Trading Guide
--- Written by Michael Boutros, Technical Currency Strategist with DailyFX
Follow Michael on Twitter @MBForex


