


- Crude Oil prices reverses off downtrend resistance- risk for further losses sub-108.18
- Check out our 2019 projections in our Free DailyFX Oil Trading Forecasts
- Join Michael for Live Weekly Strategy Webinars on Mondays at 12:30GMT
Crude Oil prices have collapsed over the past month with WTI plummeting more than 22% off the yearly highs last week. The sell-off is now once again approaching a key technical support confluence which has caught the last three attempted breakdowns in price. These are the updated targets and invalidation levels that matter on the oil price charts this week.
New to Oil Trading? Get started with this Free How to Trade Crude Oil Beginners Guide
Crude Oil Price Chart – WTI Weekly
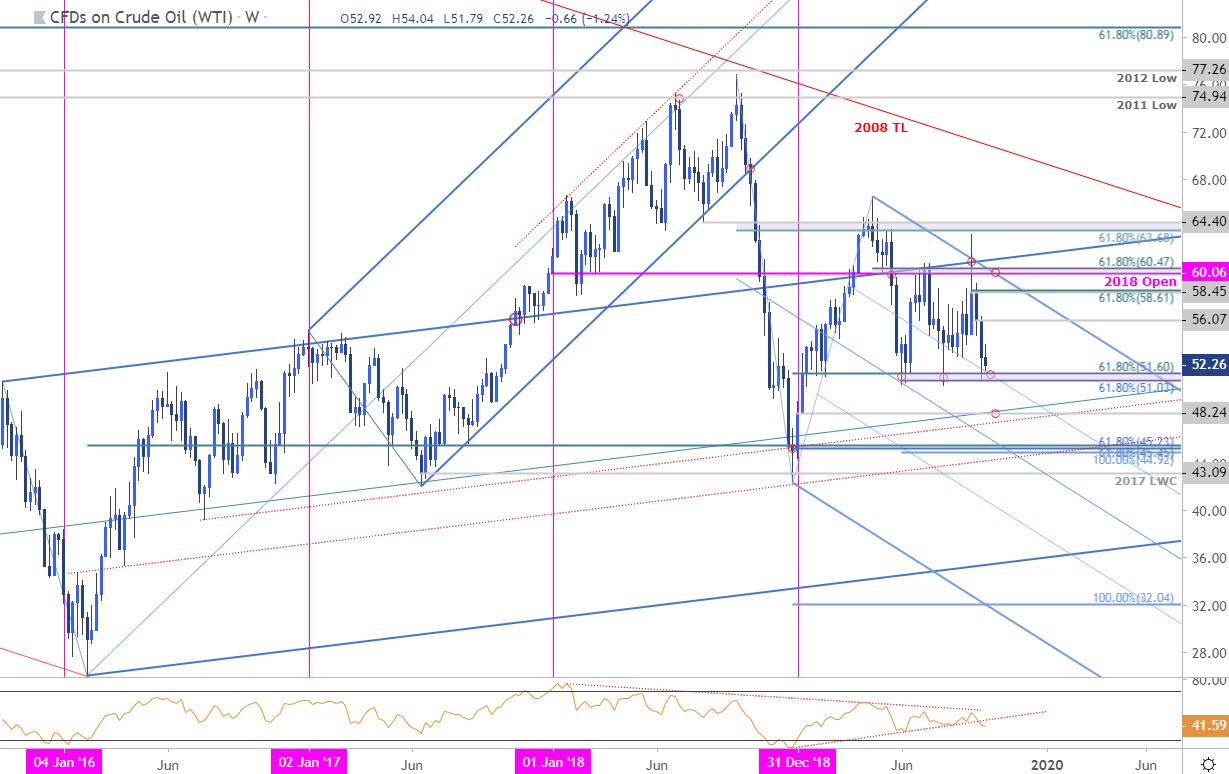
Chart Prepared by Michael Boutros, Technical Strategist; Crude Oil (WTI) on Tradingview
Notes: In my last Oil Price Outlook we noted that crude, “prices failed at key confluence resistance last week and leaves the broader downtrend intact. Form a trading standpoint, looking sideways to lower for now…” WTI is down more than 17% off the September highs with the decline now trading just above a critical support pivot we’ve been tracking for months now at 51.03/60 – a break / close below this threshold is needed to mark resumption targeting 48.24. Initial resistance stands at the late-September weekly-reversal close at 56.07 backed by the high-day close / 61.8% retracement at 58.45/61. Broader bearish invalidation steady at 60.06/47.
For a complete breakdown of Michael’s trading strategy, review his Foundations of Technical Analysis series on Building a Trading Strategy
Bottom line: Oil prices are approaching a multi-month support zone and leaves the immediate short-bias at risk while above the 51-handle. From a trading standpoint, look to reduce short-exposure / lower protective stops on a move into 51.03/60 – look for a reaction there. Ultimately a downside break is favored – be on the lookout for exhaustion ahead of 56.07on a recovery IF crude is indeed heading lower.
Crude Oil Trader Sentiment - WTI Price Chart

- A summary of IG Client Sentiment shows traders are net-long crude oil - the ratio stands at +5.96 (85.6% of traders are long) – bearish reading
- Traders have remained net-long since September 16th; price has moved 12.3% lower since then
- Long positions are 0.9% lower than yesterday and 10.7% higher from last week
- Short positions are 9.1% higher than yesterday and 6.8% lower from last week
- We typically take a contrarian view to crowd sentiment, and the fact traders are net-long suggests WTI prices may continue to fall. Yet traders are less net-long than yesterday but more net-long from last week and the combination of current positioning and recent changes gives us a further mixed crude oil trading bias from a sentiment standpoint.
See how shifts in crude oil retail positioning are impacting trend- Learn more about sentiment!
---
Previous Weekly Technical Charts
- Japanese Yen (USD/JPY)
- Canadian Dollar (USD/CAD)
- US Dollar Index (DXY)
- Australian Dollar (AUD/USD)
- Gold (XAU/USD)
- Euro (EUR/USD)
Learn how to Trade with Confidence in our Free Trading Guide
--- Written by Michael Boutros, Technical Currency Strategist with DailyFX
Follow Michael on Twitter @MBForex


