


- Updated weekly technicals on Crude Oil – price holds critical weekly resistance at 63.68-64.40
- Check out our 2019 projections in our Free DailyFX Oil Trading Forecasts
- Join Michael for Live Weekly Strategy Webinars on Mondays at 12:30GMT
In this series we scale-back and look at the broader technical picture to gain a bit more perspective on where we are in trend. Crude Oil Prices rallied to fresh yearly highs this week and although the broader outlook remains constructive, the advance is vulnerable to a larger correction heading into the close of the week. These are the updated targets and invalidation levels that matter on the WTI weekly price chart. Review this week’s Strategy Webinar for an in-depth breakdown of this setup and more.
New to Oil Trading? Get started with this Free How to Trade Crude Oil Beginners Guide
Crude Oil Weekly Price Chart (WTI)
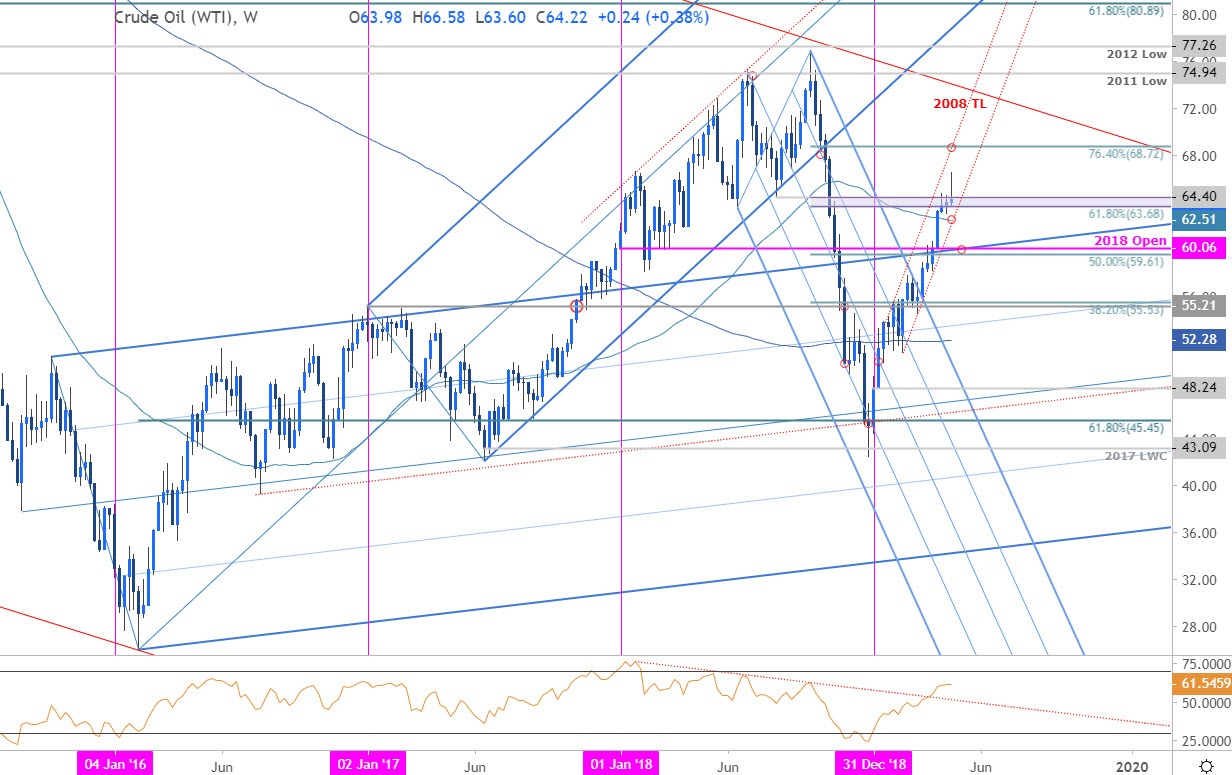
Notes: In my previous Crude Oil Weekly Outlook we noted that price was testing, “BIG resistance here and we’re looking for a reaction off the 63.68-64.40 zone heading into the close of the week.” The rally has failed to close above this threshold for the past three weeks with price poised to mark an inverted hammer off the yearly highs as RSI plateaus at the 60-threhsold. Initial support rests with the 52-week moving average at ~62.51 with broader bullish invalidation steady at 59.61-60.06. A topside breach keeps the focus yearly channel resistance / 76.4% retracement of the 2018 range at 68.72.
For a complete breakdown of Michael’s trading strategy, review his Foundations of Technical Analysis series on Building a Trading Strategy
Bottom line: Failure to close a weekly candle above this critical resistance zone leaves the long-bias vulnerable near-term. From a trading standpoint, a good place to reduce long-exposure / raise protective stops. Be on the lookout for near-term exhaustion in this zone with a pullback to ultimately offer more favorable long-entries while above 59.61. I’ll publish an updated Crude Oil Price Outlook once we get further clarity in near-term price action.
Even the most seasoned traders need a reminder every now and then- Avoid these Mistakes in your trading
Crude Oil Trader Sentiment
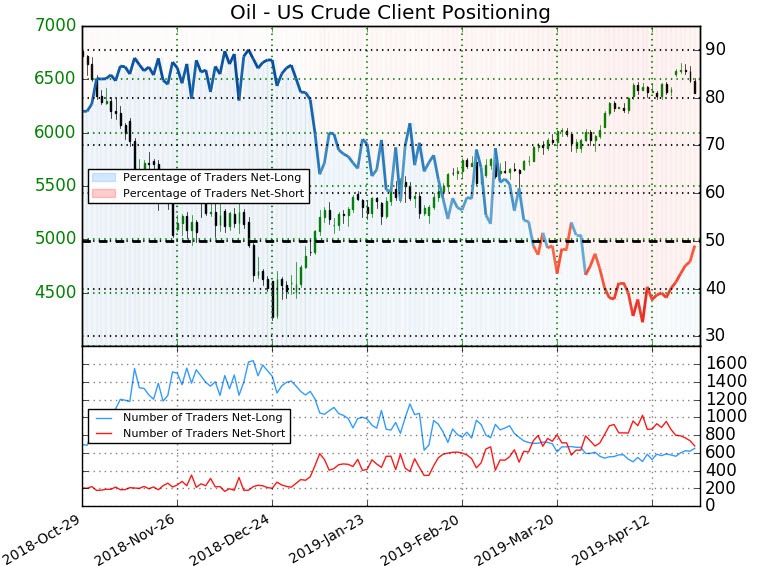
- A summary of IG Client Sentiment shows traders are net-short Crude Oil - the ratio stands at -1.84 (35.2% of traders are long) – bullish reading
- Traders have remained net-short since March 28th; price has moved 7.6% higher since then
- Long positions are 3.3% higher than yesterday and 13.0% higher from last week
- Short positions are 10.3% lower than yesterday and 21.4% lower from last week
- We typically take a contrarian view to crowd sentiment, and the fact traders are net-short suggests Oil prices may continue to rise. Yet traders are less net-short than yesterday and compared with last week. Recent changes in sentiment warn that the current Crude Oil price trend may soon reverse lower despite the fact traders remain net-short.
See how shifts in Crude Oil retail positioning are impacting trend- Learn more about sentiment!
---
Previous Weekly Technical Charts
- British Pound (GBP/USD)
- Australian Dollar (AUD/USD)
- New Zealand Dollar (NZD/USD)
- Gold (XAU/USD)
- Euro (EUR/USD)
- Canadian Dollar (USD/CAD)
- US Dollar (DXY)
Learn how to Trade with Confidence in our Free Trading Guide
--- Written by Michael Boutros, Technical Currency Strategist with DailyFX
Follow Michael on Twitter @MBForex


