


- Oil prices vulnerable to furthernear-term sub-60 – constructive while above 55.50
- Check out our 2019 projections in our Free DailyFX Oil Trading Forecasts
- Join Michael for Live Weekly Strategy Webinars on Mondays at 12:30GMT
Oil prices are higher by nearly 1% since the start of the week but crude continues to hold below a key resistance zone we’ve been tracking since the start of the year. These are the updated targets and invalidation levels that matter on the Oil charts (WTI) this week. Review this week’s Strategy Webinar for an in-depth breakdown of this setup and more.
New to Forex Trading? Get started with this Free Beginners Guide
Crude Oil Daily Price Chart (WTI)
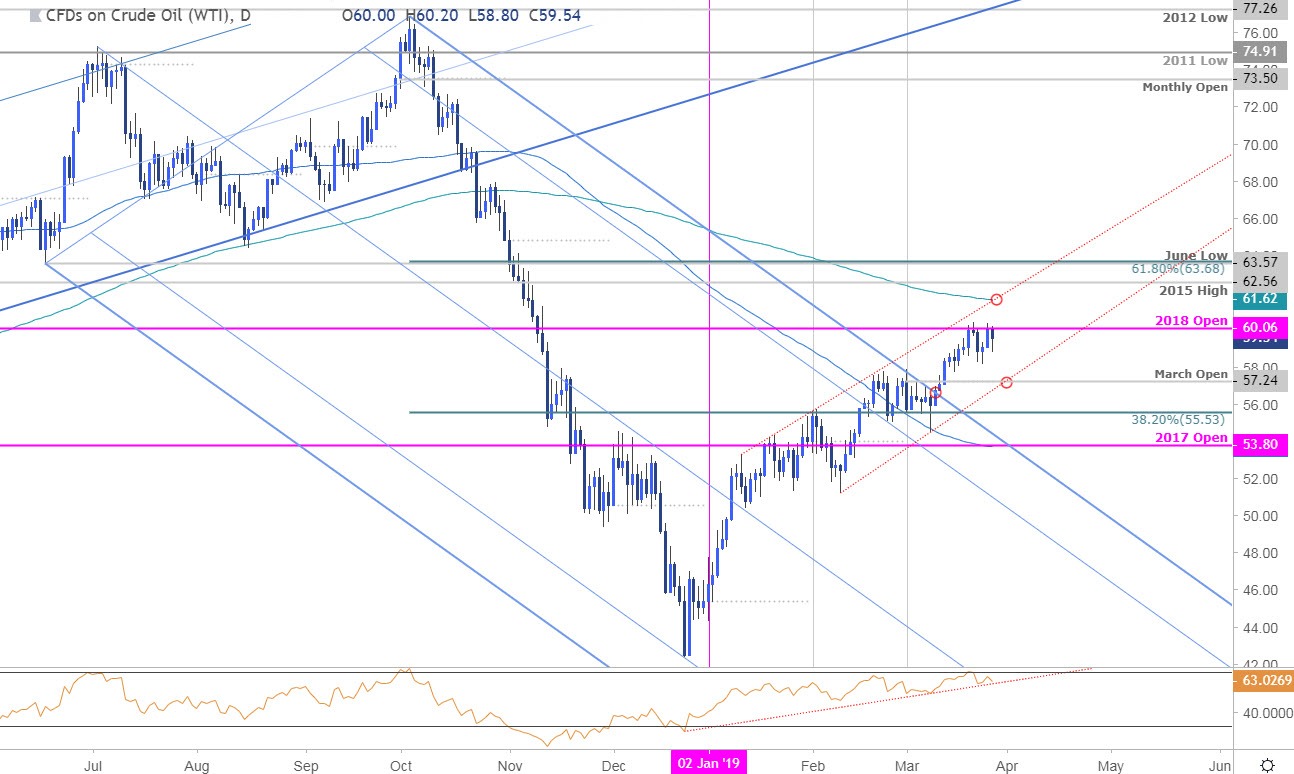
Technical Outlook: In my latest Oil Weekly Technical Outlook, we noted that price was testing a critical resistance, “confluence at 59.61-60.06 where the 50% retracement of the October decline and the 2018 open converge on the 2015/ 2016 pitchfork resistance- look for a larger reaction there IF reached.” Crude has continued to respect this region (on a close basis) for the past few weeks with price marking bearish momentum divergnce into the highs.
Daily support rests at the February trendline / monthly open at 57.24 with broader bullish invalidation at the 38.2% retracement of the 2018 range at 55.53. A topside breach / close above targets subsequent resistance objectives at the 200-day moving average at 61.62 backed by the 20165 high at 62.56.
Learn how to Trade with Confidence in our Free Trading Guide
Crude Oil 120min Price Chart (WTI)
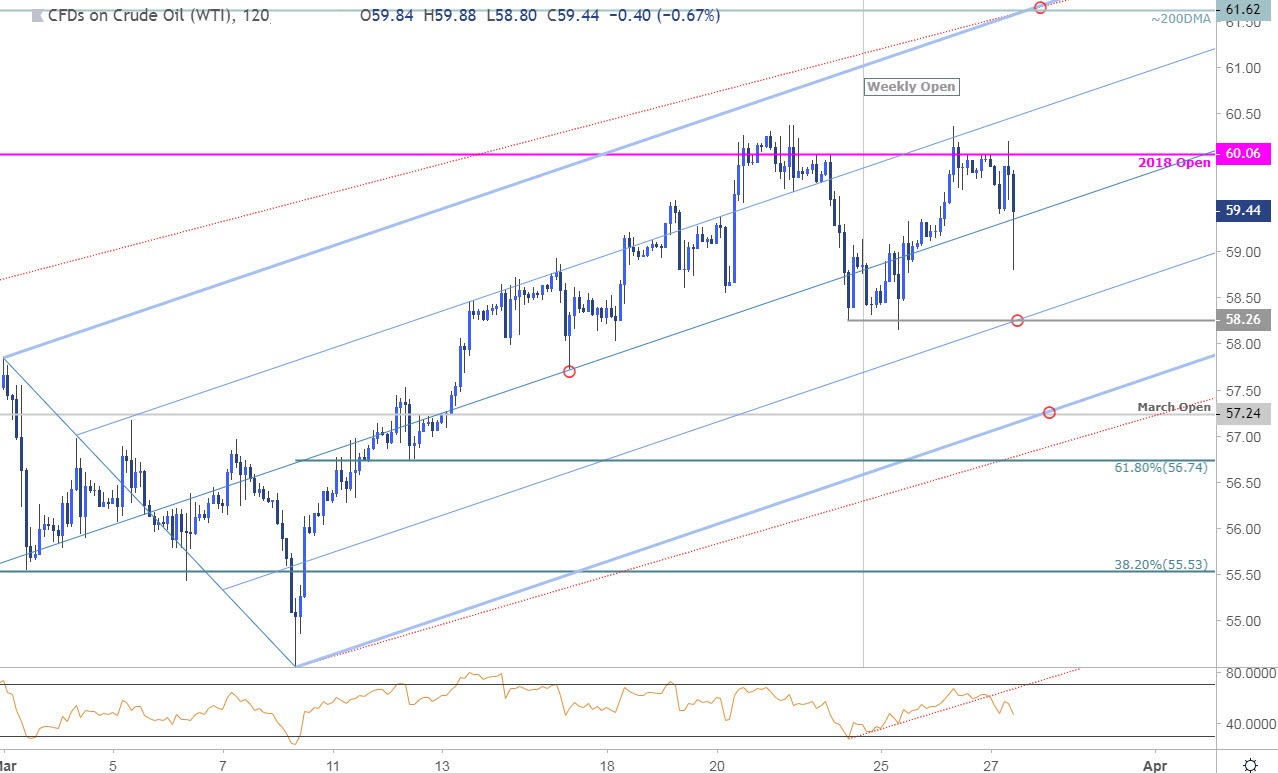
Notes: A closer look at price action shows oil trading within the con
fines of an ascending pitchfork formation extending off the late-February / March lows. Crude turned just ahead of the upper parallel last week last week with another failed attempt to mount the 60-handle this week leaving the long-bias vulnerable near-term.
Even the most seasoned traders need a reminder every now and then- Avoid these Mistakes in your trading
Bottom line: Oil prices have set the weekly opening-range just below key resistance and we’re looking for the break for guidance. From a trading standpoint, the immediate threat is lower while below 60 but the broader trade remains constructive while within this formation - IF crude prices are indeed heading higher, look for downside exhaustion ahead of the monthly open with a topside breach / close needed to fuel the next leg higher in price.
For a complete breakdown of Michael’s trading strategy, review his Foundations of Technical Analysis series on Building a Trading Strategy
Crude Oil Trader Sentiment

- A summary of IG Client Sentiment shows traders are net-short Crude Oil- the ratio stands at -1.32 (43.1% of traders are long) – weak bullish reading
- Long positions are12.7% lower than yesterday and 13.3% lower from last week
- Short positions are 17.7% higher than yesterday and 9.9% higher from last week
- We typically take a contrarian view to crowd sentiment, and the fact traders are net-short suggests Oil prices may continue to rise. Traders are further net-short than yesterday & last week, and the combination of current positioning and recent changes gives us a stronger Crude Oil-bullish contrarian trading bias from a sentiment standpoint.
See how shifts in Crude Oil retail positioning are impacting trend- Learn more about sentiment!
---
Active Trade Setups
- Kiwi Price Outlook: NZD/USD Post-RBNZ Sell-Off Targets Yearly Support
- Gold Price Outlook: XAU/USD Rally Folds from Fibonacci Resistance
- Euro Price Outlook: EUR/USD Battle Lines Drawn into March Close
- Canadian Dollar Price Outlook: USD/CAD Eyes Resistance- Rally at Risk
- British Pound Price Outlook: Brexit Game Plan Targets Sterling Range
- Written by Michael Boutros, Currency Strategist with DailyFX
Follow Michael on Twitter @MBForex


