


- Updated weekly technicals on the US Dollar Index (DXY); rally vulnerable into 97.87
- Check out our 2019 projections in our Free DailyFX USD Trading Forecasts
- Join Michael for Live Weekly Strategy Webinars on Mondays at 12:30GMT
The US Dollar Index is trading just below the yearly highs with the advance now targeting a critical long-term Fibonacci resistance confluence just higher. Here are the key targets & invalidation levels that matter on the US Dollar Index (DXY) weekly chart. Review this week's Strategy Webinar for an in-depth breakdown of this setup and more.
New to Forex Trading? Get started with this Free Beginners Guide
DXY Weekly Price Chart

Notes: In my previous US DollarWeekly Technical Outlook we noted that the index was approaching resistance at the 2018, “high-week close a 97.42 with a breach above key resistance at 97.87 needed to fuel the next leg higher in the Dollar.” Price has continued to respect this threshold on a weekly close basis with the greenback trading just below this zone ahead of the New York close on Friday (note the pending RSI resistance trigger in momentum).
Initial weekly support rests with the 200-week moving average at 95.90 and is backed closely by the low-week close at 95.66. Ultimately a break below the 2018 support line / 2019 opening-range lows at 95.03 is needed to suggest a more significant reversal is underway. A topside breach above the key 61.8% retracement at 97.87 exposes subsequent topside objectives at the highlighted trendline confluence around 99.30s.
For a complete breakdown of Michael’s trading strategy, review his Foundations of Technical Analysis series on Building a Trading Strategy
Bottom line: The US Dollar Index is once again testing BIG resistance into the start of 2Q trade. The immediate advance remains vulnerable while below confluence resistance at 97.87. From a trading standpoint, a good spot to reduce long-exposure / raise protective stops. Looking for possible price exhaustion / reaction on a test higher for guidance- ultimately a close above is needed to keep the long-bias viable targeting slope resistance.
Even the most seasoned traders need a reminder every now and then- Avoid these Mistakes in your trading
Relevant US Economic Data Releases
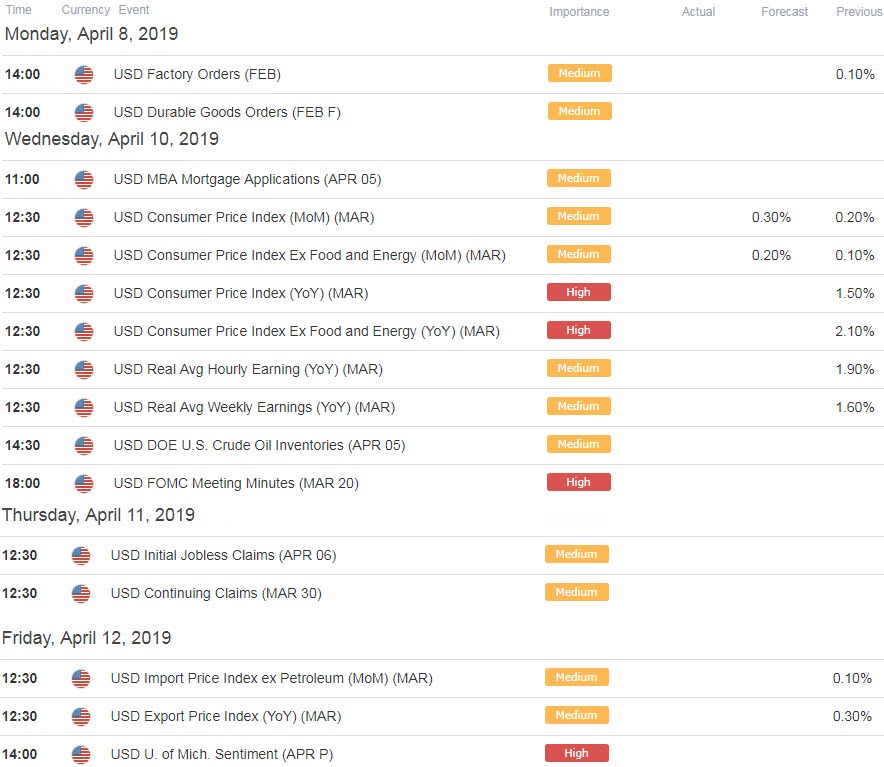
Economic Calendar - latest economic developments and upcoming event risk. Learn more about how we Trade the News in our Free Guide !.
Previous Weekly Technical Charts
- British Pound (GBP/USD)
- Gold (XAU/USD)
- Australian Dollar (AUD/USD)
- New Zealand Dollar (NZD/USD)
- Euro (EUR/USD)
- Crude Oil (WTI)
- Canadian Dollar (USD/CAD)
Learn how to Trade with Confidence in our Free Trading Guide
--- Written by Michael Boutros, Technical Currency Strategist with DailyFX
Follow Michael on Twitter @MBForex


