


- Updated weekly technicals on Crude Oil – price testing key resistance zone at 63.68-64.40
- Check out our 2019 projections in our Free DailyFX Crude Oil Trading Forecasts
- Join Michael for Live Weekly Strategy Webinars on Mondays at 12:30GMT
In this series we scale-back and look at the broader technical picture to gain a bit more perspective on where we are in trend. Crude Oil Prices are up more than 33% since the start of the year with the breakout now testing a major technical resistance zone at five-month highs early in the month. These are the updated targets and invalidation levels that matter on the WTI weekly price chart. Review this week’s Strategy Webinar for an in-depth breakdown of this setup and more.
New to Oil Trading? Get started with this Free How to Trade Crude Oil Beginners Guide
Crude Oil Weekly Price Chart (WTI)
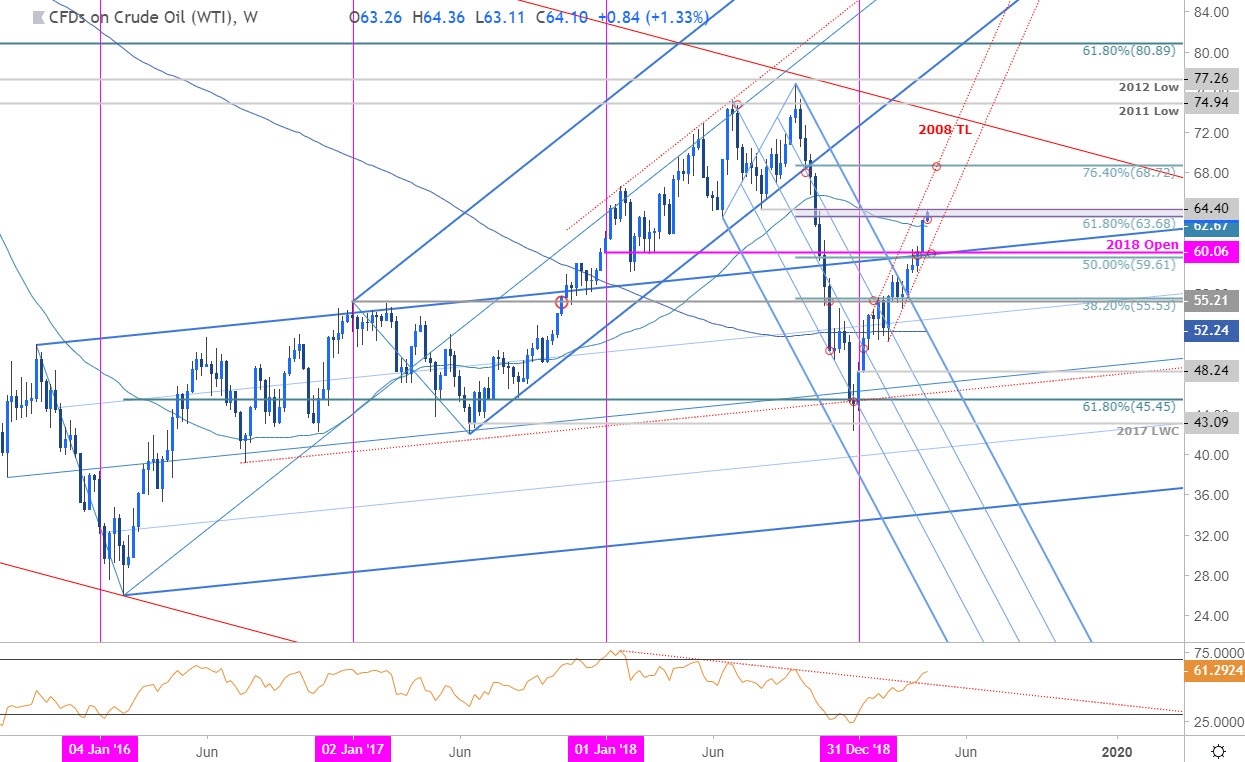
Notes: In my previous Crude Oil Weekly Technical Outlook we noted that price was testing a key resistance zone at 59.61-60.06 - “A weekly close above would be needed to suggest that a more meaningful low was registered in December with such a scenario targeting the 52-week moving average at ~62.82 and the 61.8% retracement of the 2018 decline at 63.68.” Price is testing this resistance zone into the August low at 64.40 early in the week and leaves the immediate advance at risk while below.
A breach / close above is needed to keep the long-bias viable targeting channel resistance / 68.72. Key support / bearish invalidation now raised to the Monthly open / 50% retracement at 59.61-60.14 -Weakness beyond this threshold would risk a larger correcting in price.
For a complete breakdown of Michael’s trading strategy, review his Foundations of Technical Analysis series on Building a Trading Strategy
Bottom line: Crude prices are testing BIG resistance here and we’re looking for a reaction off the 63.68-64.40 zone heading into the close of the week. From a trading standpoint, a good place to reduce long-exposure / raise protective stops. Be on the lookout for possible near-term exhaustion near this zone with a pullback to ultimately offer more favorable long-entries while above 59.61. I’ll publish an updated Crude Oil Price Outlook once we get further clarity in near-term price action.
Even the most seasoned traders need a reminder every now and then- Avoid these Mistakes in your trading
Crude Oil Trader Sentiment

- A summary of IG Client Sentiment shows traders are net-short Crude Oil - the ratio stands at -1.84 (35.2% of traders are long) – bullish reading
- Traders have remained net-short since March 28th; price has moved 8.1% higher since then
- The percentage of traders net-long is now its lowest since September 4th
- Long positions are 11.8% lower than yesterday and 19.1% lower from last week
- Short positions are 8.5% higher than yesterday and 24.8% higher from last week
- We typically take a contrarian view to crowd sentiment, and the fact traders are net-short suggests Oil prices may continue to rise. Traders are further net-short than yesterday and last week, and the combination of current positioning and recent changes gives us a stronger Crude Oil-bullish contrarian trading bias from a sentiment standpoint.
See how shifts in Crude retail positioning are impacting trend- Learn more about sentiment!
---
Previous Weekly Technical Charts
- US Dollar (DXY)
- British Pound (GBP/USD)
- Gold (XAU/USD)
- Australian Dollar (AUD/USD)
- New Zealand Dollar (NZD/USD)
- Euro (EUR/USD)
- Canadian Dollar (USD/CAD)
Learn how to Trade with Confidence in our Free Trading Guide
--- Written by Michael Boutros, Technical Currency Strategist with DailyFX
Follow Michael on Twitter @MBForex


