


Near-term Technical Outlook: Trade Setups on EUR/USD, USD/MXN & USD/CAD
- Technical daily charts on setup we’ve been tracking in EUR/USD, USD/MXN & USD/CAD
- Euro testing monthly range highs on building divergence
- Peso seven-day rally halted as USD/MXN sell-off rebounds off initial support
- USD/CAD break below May opening-range keeps focus lower while below 1.3945
An update on trade setups we've been tracking inEuro, Peso & Loonie. These are the targets and invalidation levels that matter next week. Review my latest Strategy Webinar for an in-depth breakdown of thesetrade setups and more.
Euro Price Chart - EUR/USD Daily

Chart Prepared by Michael Boutros, Technical Strategist; EUR/USD on Tradingview
In my most recent EUR/USD Technical Price Outlook we noted that we were, “on the lookout for downside exhaustion while above the May low-day close 1.0831 IF price is indeed heading higher. A breach / close above 1.1187 is needed to shift the broader focus back to the topside heading deeper into June.” Euro is attempting to breach resistance today at the 61.8% retracement of the late-March decline at 1.0987 with the objective May opening-range highs just higher at 1.1019. Note the threat of mounting price divergence in the momentum profile- we’re looking for a reaction up here.
A topside breach keeps the focus on confluence Fibonacci resistance at 1.1058/59 backed by the 2019 trendline, currently just shy of 1.11. Key support steady at the monthly low-day reversal close at 1.0832 – look for downside exhaustion ahead of this level on pullbacks IF price is indeed heading higher on this stretch. A close below 1.0777 would be needed to mark resumption of the broader short-bias.

Mexican Peso Price Chart – USD/MXN Daily

Chart Prepared by Michael Boutros, Technical Strategist; USD/MXN on Tradingview
In my last Mexican Peso Technical Outlook we noted that,“From a trading standpoint, look to reduce short-exposure / lower protective stops on a test of Fibonacci support with a break / close below 23.9074 needed to keep the focus lower in the dollar.” A break below the May opening-range low on the 20th fueled a decline of more than 6.5% with USD/MXN responding to confluence support yesterday at the 50% retracement of the yearly range / 25% parallel around ~22.1504.
Initial resistance now at the 100% extension / median-line at 22.7811- look for failure ahead of this threshold IF price is heading lower on this stretch. Broader bearish invalidation now lowered to 23.5491. A break lower from here would expose a larger decline towards a more critical support confluence at the lower parallel / 61.8% extension / 61.8% retracement at 21.2317/2942.
Canadian Dollar Price Chart - USD/CAD Daily
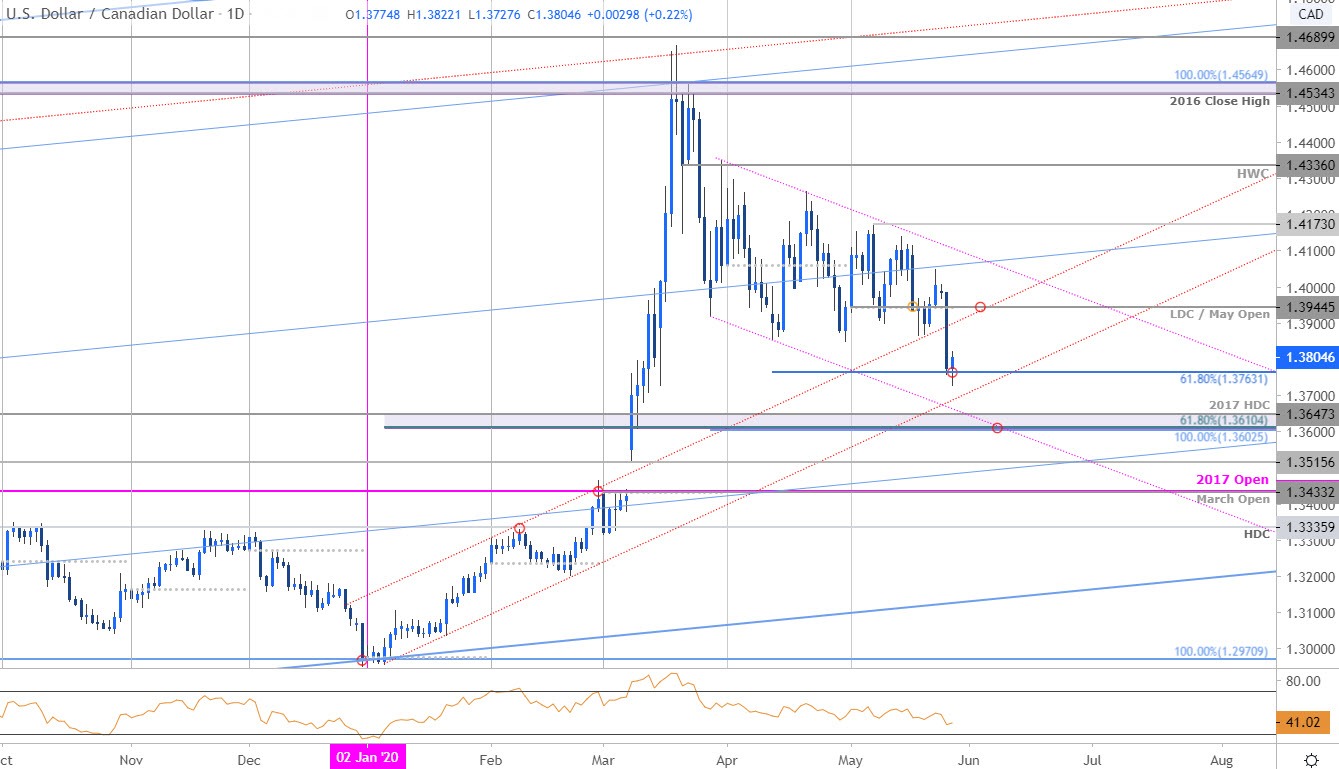
Chart Prepared by Michael Boutros, Technical Strategist; USD/CAD on Tradingview
In my latest Canadian Dollar Price Outlook we noted that USD/CAD was, “contracting within the April price range and the broader focus is on a breakout of the 1.3945–1.4176 range for guidance. From a trading standpoint, look for topside exhaustion ahead of the late-March trendline IF price is indeed heading lower with a break below the objective May opening-range needed to fuel the next leg lower in price.” Loonie broke the range-lows yesterday with the decline now challenging the 61.8% extension of the March decline at 1.3763 – watch the close here.
The focus remains weighted to the downside while below the April low-day close / May open at 1.3945 with subsequent support objectives eyed at the January trendline (currently near ~1.37) backed by the 2017 high-day close at 1.3647 and the Fibonacci confluence at 1.3602/10- both levels of interest for possible downside exhaustion IF reached. Review my latest Canadian Dollar Weekly Price Outlook for a closer look at the longer-term USD/CAD technical trading levels.
Canadian Dollar Trader Sentiment – USD/CAD Price Chart

- A summary of IG Client Sentiment shows traders are net-short USD/CAD - the ratio stands at -1.13 (47.01% of traders are long) – neutral reading
- Long positions are 8.89% higher than yesterday and 14.04% lower from last week
- Short positions are 36.48% higher than yesterday and 44.08% higher from last week
- We typically take a contrarian view to crowd sentiment, and the fact traders are net-short suggests USD/CAD prices may continue to rise. Traders are further net-short than yesterday and last week, and the combination of current positioning and recent changes gives us a stronger USD/CAD-bullish contrarian trading bias from a sentiment standpoint.
| Change in | Longs | Shorts | OI |
| Daily | 0% | -13% | -8% |
| Weekly | 42% | -22% | -3% |
For a complete breakdown of Michael’s trading strategy, review his Foundations of Technical Analysis series on Building a Trading Strategy
-Written by Michael Boutros, Currency Strategist with DailyFX
Follow Michaelon Twitter @MBForex


