Talking Points:
- DailyFX Quarterly Forecasts have been updated for Q3, and are available directly from the following link: DailyFX Trading Guides, Q3 Forecasts.
- For trading ideas, please check out our Trading Guides. And if you’re looking for something more interactive in nature, please check out our DailyFX Live webinars.
- If you’d like more color around any of the setups below, we discuss these in our live DailyFX webinars each week, set for Tuesday and Thursday at 1PM Eastern Time. You can sign up for each of those session from the below link:
Tuesday: Tuesday, 1PM ET
Thursday: Thursday 1PM ET
Do you want to see how retail traders are currently trading the US Dollar? Check out our IG Client Sentiment Indicator.
US Dollar Drops to Decision Point
As we move towards the end of the summer, a number of FX themes remain of interest. While the Labor Day holiday in the United States, now just a week away, normally marks the end of the summer months across markets, the past few weeks have been abnormally active. There are a series of themes percolating around the world that can serve to keep volatility flowing as we move into the final month of Q3, and below we look into a few of those.
A big item of interest right now is the US Dollar as we’re nearing a make-or-break scenario for the bullish up-trend. While the Greenback spent fourteen months in a down-trend from the start of 2017, price action after the month of April has been very bullish. Many attributed this to rate policy, as the Federal Reserve is one of the only major Central Banks actively looking to push tighter policy and higher rates; but that’s been the same since before the beginning of last year. Last year saw the Fed hike three times; and this year has brought another two.
This means that the Fed has hiked at six out of seven quarterly FOMC meetings (with a press conference and updated economic projections) since the election of President Donald Trump. Nonetheless, US Dollar strength really didn’t start to show up until April of this year after falling by as much as 15% last year. Support finally came-in at the 50% marker of the 2011-2017 major move, and last week saw resistance build at the 23.6% marker of the same study. With this week’s continued sell-off, we now have an evening star formation on the weekly chart of the US Dollar. This can be attractive for trading bearish reversals, particularly if the formation built around a key point of resistance on the chart. The complication here would be the fact that short-term support remains around the 95.00 level, and this could be a constraint to bearish USD approaches until that changes.
So, at this point, the US Dollar remains bullish; but that can quickly change should prices break-below support in the early portion of next week. The setups we look at below will reflect that stance; and it should be noted that these setups are designed for next week’s price action, as a weekend gap through support or resistance can vastly alter the nature of the setup.
US Dollar Weekly Price Chart: Evening Star at Resistance, but Confluent Support Remains
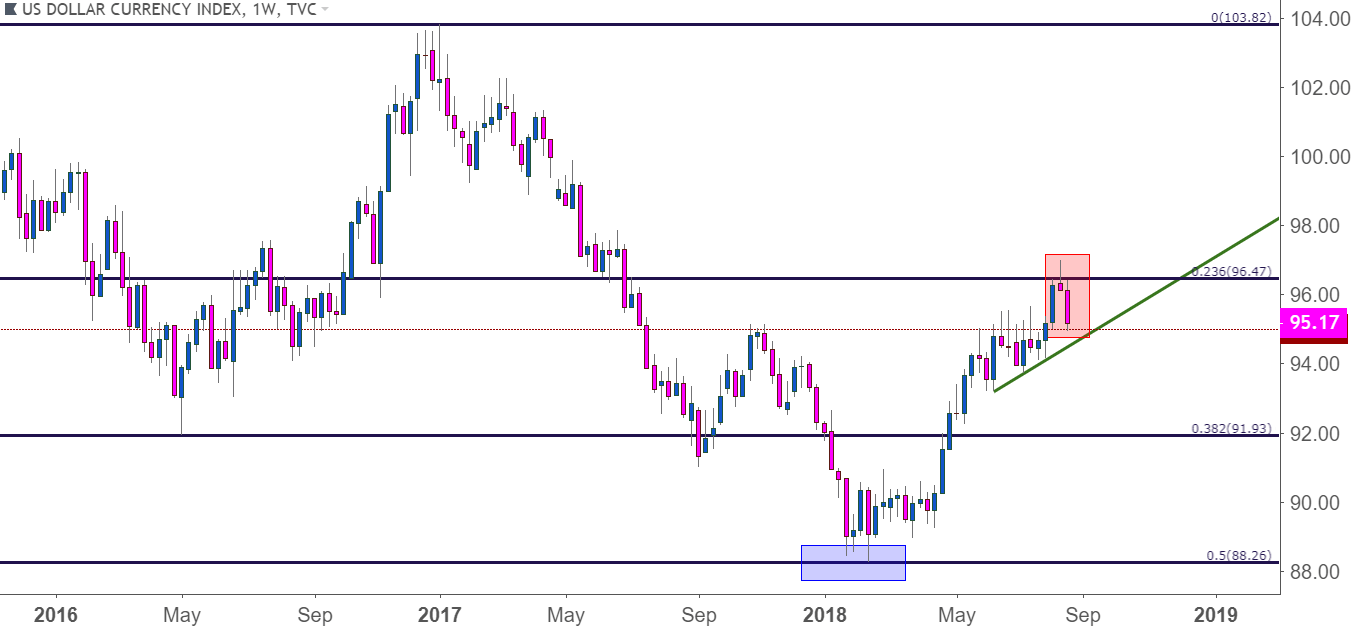
Chart prepared by James Stanley
Bearish EUR/USD Until 1.1750; Bullish Thereafter
Can Euro bulls hold on to the recovery as Turkish markets re-open from a week-long holiday? That is the big question around the currency for next week.
The sell-off in EUR/USD was quite visible through the first half of August, driven in large-part by fears of contagion within the European banking sector with exposure to the still developing scenario in Turkey. But Turkish markets were on holiday all week, and this fear appeared to move behind the headlines as EUR/USD clawed back prior August losses.
At this point, price continues to hold around the ‘r3’ level that we had looked at last week, and this takes place around the confluent resistance in the pair that showed-up just ahead of the earlier-month sell-off. This can help to retain a bearish stance in EUR/USD, and we’re also adding one additional resistance zone that runs from 1.1710 up to 1.1750. If prices break above 1.1750, then we’d have fresh monthly highs and the bearish theme should be abandoned. This scenario would likely need to be coupled with a larger breakdown in the US Dollar; but, until then, the potential for EUR/USD continuation of the longer-term trend bearish trend remains.
EUR/USD Four-Hour Price Chart
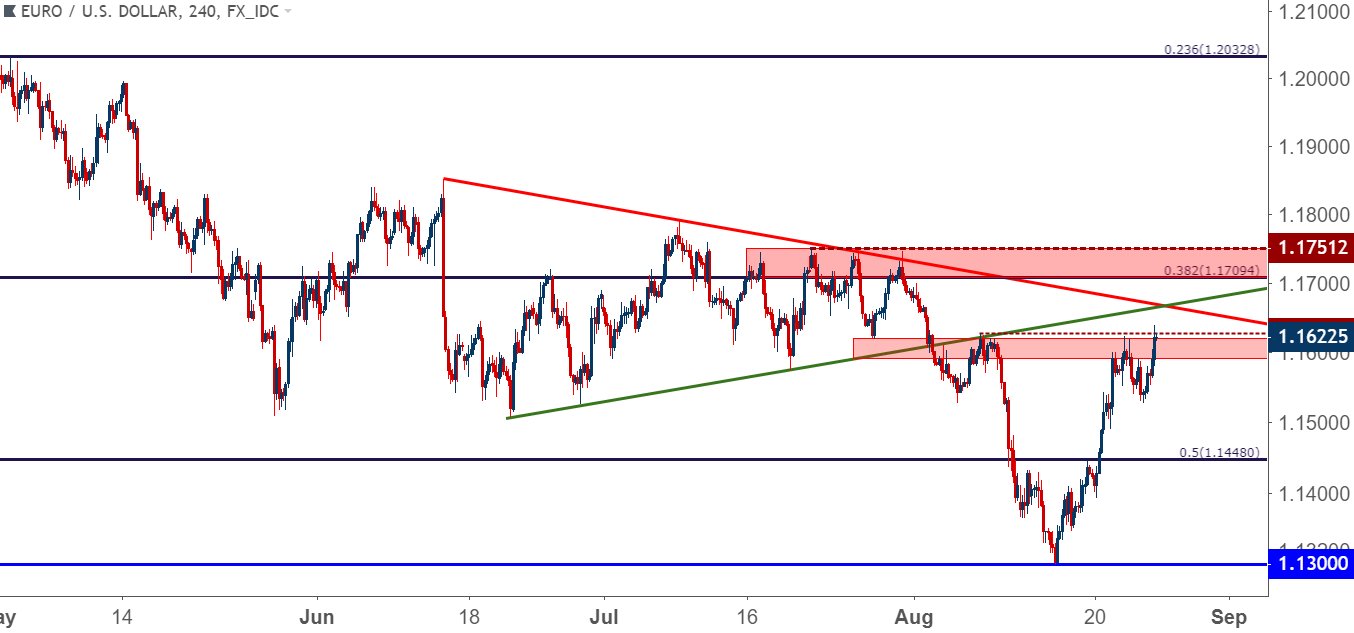
Chart prepared by James Stanley
Bearish GBP/USD Until 1.2975
Last week we looked at bullish themes in GBP/USD and prices topped out at our second target of resistance. Afterwards, prices sank back down to the first zone of resistance, and we have a bit of digestion showing over the past 12 hours.
As we wrote in this week’s fundamental forecast on the British Pound, there is little to be excited about for the currency at the moment. Inflation remains subdued from earlier-year levels, and the BoE just hiked, so we probably won’t be seeing any rate adjustments anytime soon. We also have the upcoming UK-EU showdown over Brexit negotiations, and this carries an air of vulnerability as well as it appears that a ‘Hard Brexit’ scenario is very much on the table. As a matter of fact, one of the primary reasons for last week’s search of strength in the pair was just how incredibly bearish and oversold the pair had become.
This week saw GBP/USD bounce, but the big question is whether that bounce was large enough to bring new fresh sellers into the market in order to push prices down to fresh new lows.
So, while the fundamental backdrop is rather unclear here, as indicated by our neutral stance in this week’s forecast, the technical setup is a bit more interesting as it appears as though there is bearish potential. For next week, I’m looking for a bottom-side break of the support trend-line that’s shown in the pair on a way to a re-test of that Fibonacci support at 1.2671. This can allow for stops above the 1.2975 area on the chart to retain a better than one-to-one risk-reward ratio on the initial target; after which bearish breakouts could be sought with the remainder of the lot.
GBP/USD Four-Hour Price Chart
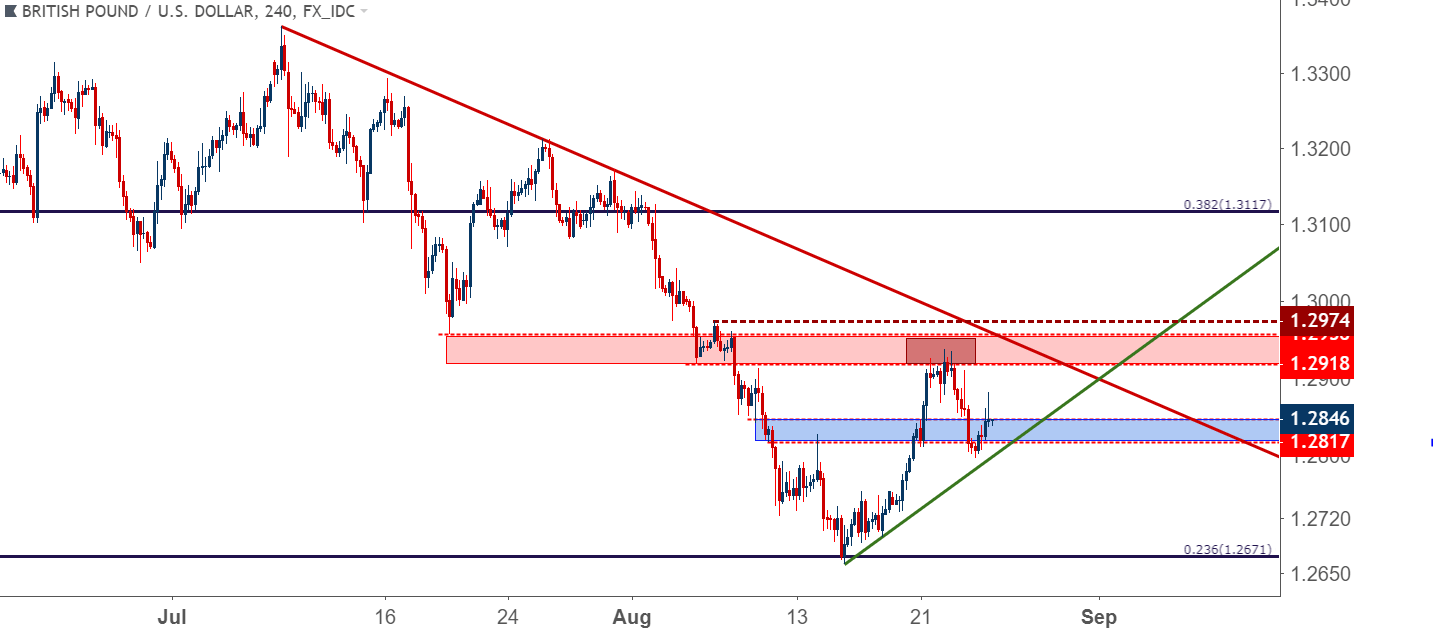
Chart prepared by James Stanley
To read more:
Are you looking for longer-term analysis on the U.S. Dollar? Our DailyFX Forecasts for Q1 have a section for each major currency, and we also offer a plethora of resources on USD-pairs such as EUR/USD, GBP/USD, USD/JPY, AUD/USD. Traders can also stay up with near-term positioning via our IG Client Sentiment Indicator.
Forex Trading Resources
DailyFX offers a plethora of tools, indicators and resources to help traders. For those looking for trading ideas, our IG Client Sentiment shows the positioning of retail traders with actual live trades and positions. Our trading guides bring our DailyFX Quarterly Forecasts and our Top Trading Opportunities; and our real-time news feed has intra-day interactions from the DailyFX team. And if you’re looking for real-time analysis, our DailyFX Webinars offer numerous sessions each week in which you can see how and why we’re looking at what we’re looking at.
If you’re looking for educational information, our New to FX guide is there to help new(er) traders while our Traits of Successful Traders research is built to help sharpen the skill set by focusing on risk and trade management.
--- Written by James Stanley, Strategist for DailyFX.com
Contact and follow James on Twitter: @JStanleyFX