


Canadian Dollar Technical Forecast: USD/CAD Weekly Trade Levels
- Canadian Dollar updated technical trade levels - Weekly Chart
- USD/CAD pullback marks fourth-weekly decline- now testing first major support pivot
- Support 1.3225, 1.3116, 1.2975-1.3023 – Resistance 1.3370, 1.3516, 1.3881
The US Dollar plunged more than 4.6% from the highs against the Canadian Dollar with a four-week decline taking USD/CAD into confluent technical support. I’m on the lookout for possible price inflection at these levels in the days ahead for guidance. These are the updated targets and invalidation levels that matter on the USD/CAD weekly technical price chart. Review my latest Strategy Webinar for an in-depth breakdown of this Loonie setup and more.

Canadian Dollar Price Chart – USD/CAD Weekly
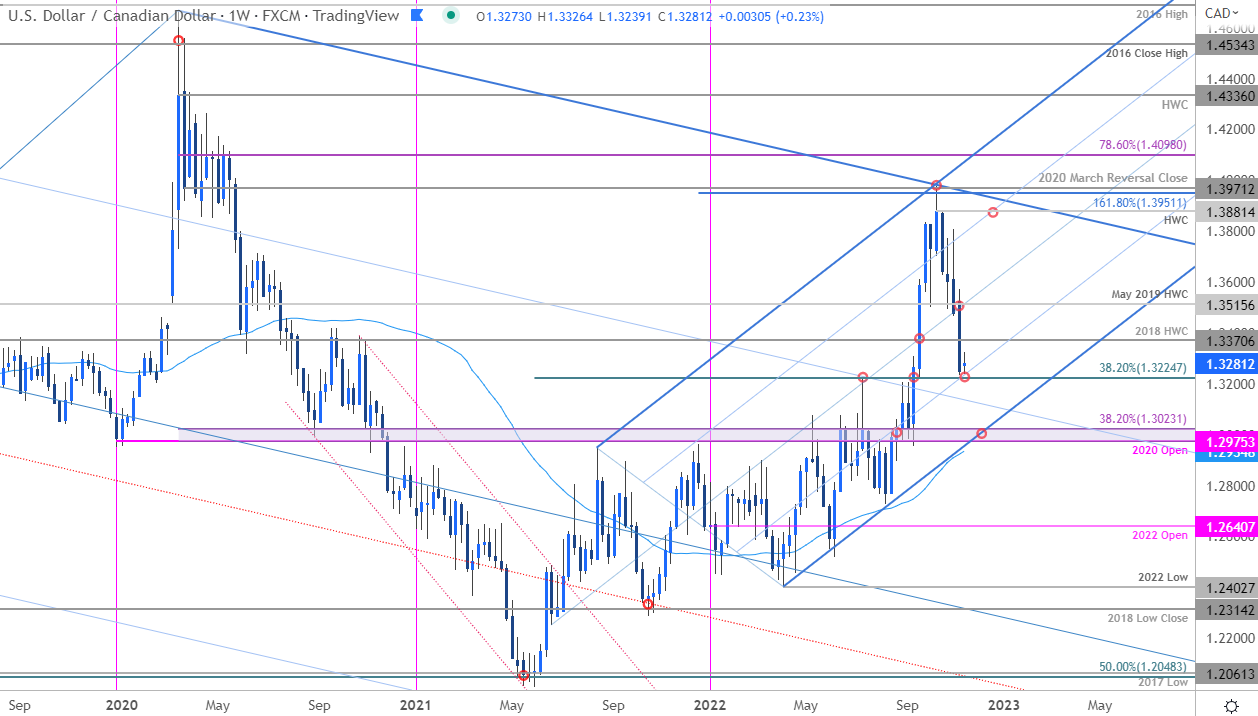
Chart Prepared by Michael Boutros, Technical Strategist; USD/CAD on Tradingview
Notes: In last month’s Canadian Dollar Weekly Technical Forecast, I warned to be on the lookout for a larger pullback in USD/CAD with break below the October range, “exposing subsequent objectives at the 2018 high-week close at 1.3370 and the 38.2% retracement at 1.3225- both zones of interest for possible exhaustion / price inflection IF reached.” The sell-off registered a low at 1.3236 last week with USD/CAD carving this week’s opening-range just above.
A break below this threshold would threaten a deeper plunge towards subsequent support objectives at the July high-week close at 1.3116 and 1.2975-1.3023- a region defined by the 2020 yearly open and the 38.2% Fibonacci retracement of the 2020 decline. Note that pitchfork support also converges on this pivot zone over the next few weeks- look for a larger reaction there IF reached.
Initial resistance now eyed at the 2018 high-week close at 1.3370 backed by the May 2019 high-week close at 1.3515. Ultimately a breach / weekly close above the median-line would be needed to shift the broader focus higher again towards key resistance around the yearly highs.
Bottom line: USD/CAD has plummeted into confluent support and while the threat for a larger pullback remains, the immediate decline may be vulnerable here near-term. From a trading standpoint, a good zone to reduce portions of short-exposure / lower protective stops. Rallies should be limited to 1.3515 IF price is indeed lower on this stretch - look for a larger reaction into 1.30 IF reached. I’ll publish an updated Canadian Dollar Shor-term Price Outlook once we get further clarity on the near-term USD/CAD technical trade levels.
For a complete breakdown of Michael’s trading strategy, review his Foundations of Technical Analysis series on Building a Trading Strategy
Canadian Dollar Trader Sentiment – USD/CAD Price Chart
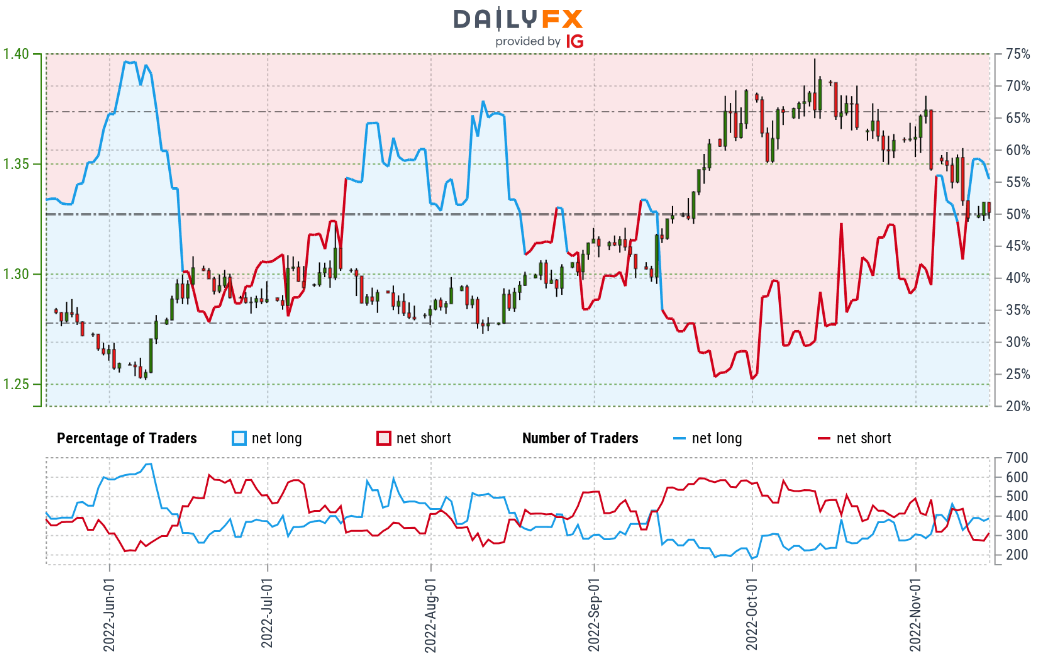
- A summary of IG Client Sentiment shows traders are net-long USD/CAD - the ratio stands at +1.38 (58.06% of traders are long) – typically weak bearish reading
- Long positions are 2.11% higher than yesterday and 6.64% lower from last week
- Short positions are 10.92% higher than yesterday and 30.31% lower from last week
- We typically take a contrarian view to crowd sentiment, and the fact traders are net-long suggests USD/CAD prices may continue to fall. Traders are less net-long than yesterday but more net-long from last week. The combination of current positioning and recent changes gives us a further mixed USD/CAD trading bias from a sentiment standpoint.
| Change in | Longs | Shorts | OI |
| Daily | -2% | 7% | 5% |
| Weekly | -30% | 38% | 13% |
US / Canada Economic Calendar
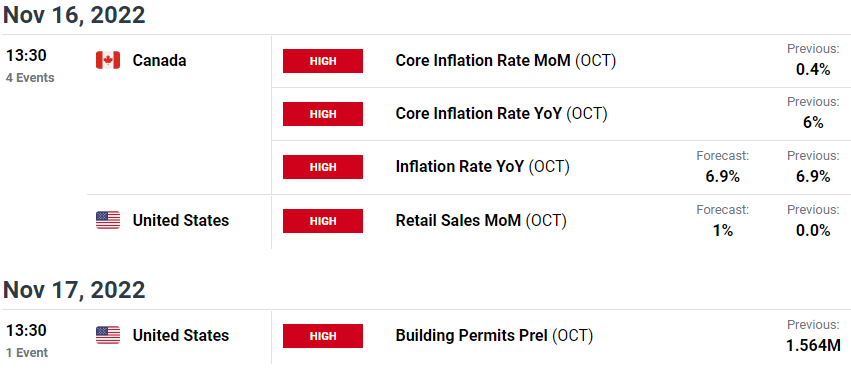
Economic Calendar - latest economic developments and upcoming event risk.
Active Weekly Technical Charts
- Japanese Yen (USD/JPY)
- Gold & Silver
- British Pound (GBP/USD)
- Crude Oil (WTI)
- S&P 500, Nasdaq & Dow
- Australian Dollar
- Euro (EUR/USD)
--- Written by Michael Boutros, Technical Strategist with DailyFX
Follow Michael on Twitter @MBForex


