


Japanese Yen Technical Price Forecast: USD/JPY Weekly Trade Levels
- Japanese Yen technical trade levels update – Weekly Chart
- USD/JPY breaks yearly trend support- risk for larger correction
- Support 137.25-138.48, 136, 131.25 - Resistance 143.61, 146.79-147.65 (key), 152
The US Dollar is attempting to snap a four-week losing streak against the Japanese Yen with USD/JPY up nearly 0.9% since the weekly open. A rebound off technical support may offer a short reprieve but the broader threat for a deeper correction remains after breaking below yearly uptrend support. These are the updated targets and invalidation levels that matter on the USD/JPY weekly price chart. Review my latest Weekly Strategy Webinar for an in -depth breakdown of this USD/JPY technical setup and more.

Japanese Yen Price Chart – USD/JPY Weekly
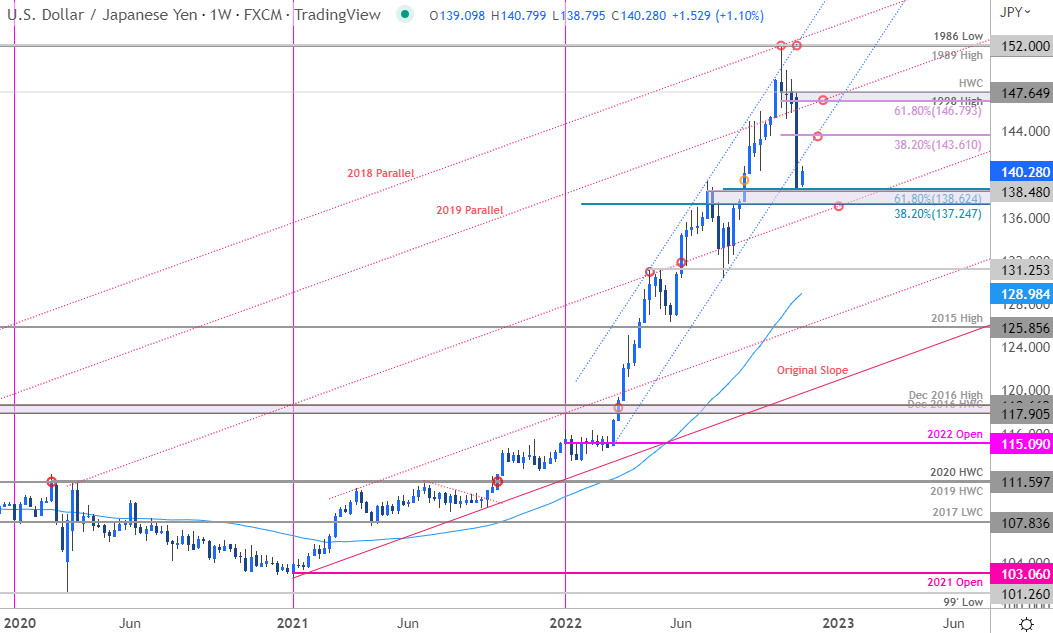
Chart Prepared by Michael Boutros, Technical Strategist; USD/JPY on Tradingview
Technical Outlook: In last month’s Japanese Yen Technical Forecast I noted that the, “USD/JPY rally has responded to technical resistance and threatens a larger correction within the confines of the yearly uptrend.” USD/JPY has now plunged nearly 9% off the yearly highs with the decline breaking below February channel support. Although the move threatens a larger pullback in the weeks ahead, the immediate decline is challenging the upper bounds of a key pivot-zone here at 137.25-138.62- a region defined by the 38.2% retracement of the yearly range, the July high-week close and the 61.8% Fibonacci retracement of the August advance. The focus is on a reaction off this threshold in the days ahead for guidance.
Initial weekly resistance now eyed the 38.2% retracement of the October sell-off at 143.61 with medium-term bearish invalidation now lowered to the 61.8% retracement / 1998 high / 2022 high0week close at 146.79-147.65. A break lower from here would expose parallel support (red dotted-line, currently ~136) backed by the April / May highs around 131.25- both zones of interest for possible downside exhaustion / price inflection IF reached.
For a complete breakdown of Michael’s trading strategy, review his Foundations of Technical Analysis series on Building a Trading Strategy
Bottom line: The USD/JPY has broken below yearly uptrend support with the decline already checking the first major pivot zone here around 138. From a trading standpoint, rallies should be capped by 143.61 IF price is indeed heading lower on this stretch with a break / close below parallel support needed to suggest a larger trend reversal may be underway. I’ll publish an updated Japanese Yen Short-term Outlook once we get further clarity on the near-term USD/JPY technical trade levels.
Japanese Yen Trader Sentiment – USD/JPY Price Chart
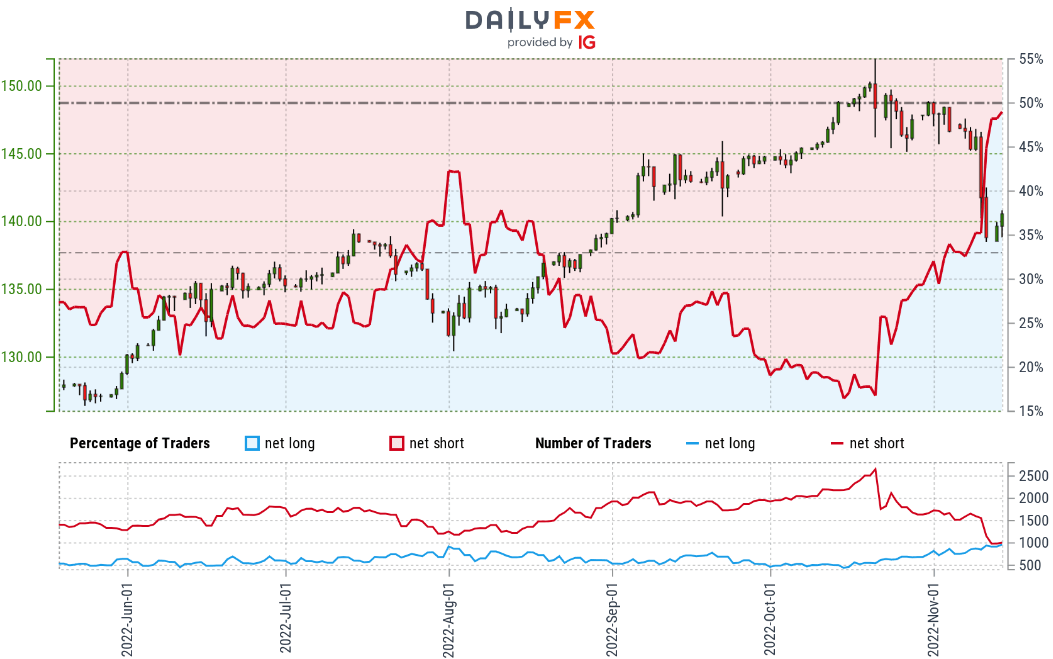
- A summary of IG Client Sentiment shows traders are net-short USD/JPY - the ratio stands at -1.10 (47.55% of traders are long) – typically neutral reading
- Long positions are 8.53% higher than yesterday and 20.25% higher from last week
- Short positions are 11.21% higher than yesterday and 33.68% lower from last week
- We typically take a contrarian view to crowd sentiment, and the fact traders are net-short suggests USD/JPY prices may continue to rise. Yet traders are more net-short than yesterday but less net-short from last week and the combination of current positioning / recent changes gives us a further mixed USD/JPY trading bias from a sentiment standpoint.
| Change in | Longs | Shorts | OI |
| Daily | -2% | 2% | 0% |
| Weekly | 12% | -16% | -6% |
US / Japan Economic Calendar
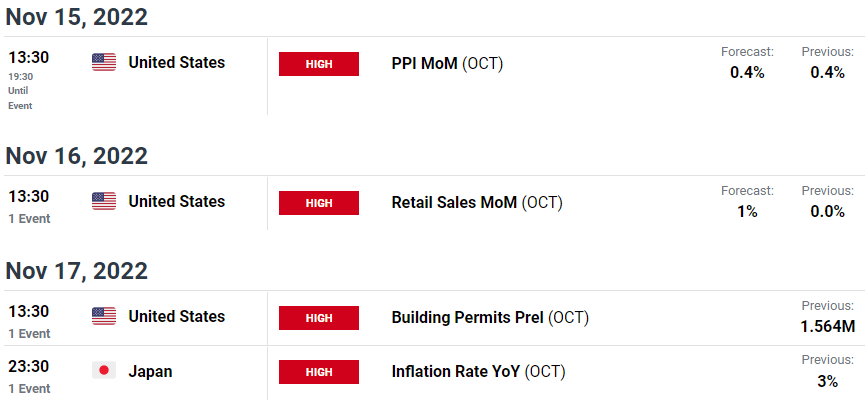
Economic Calendar - latest economic developments and upcoming event risk.
Active Weekly Technical Charts
- Gold & Silver
- British Pound (GBP/USD)
- Crude Oil (WTI)
- Canadian Dollar (USD/CAD)
- S&P 500, Nasdaq & Dow
- Australian Dollar
- Euro (EUR/USD)
Foundational Trading Knowledge
Forex for Beginners
New to Forex Trading? Get started with this Beginners Guide
--- Written by Michael Boutros, Technical Strategist with DailyFX
Follow Michael on Twitter @MBForex


