


Short-term Trade Outlook: Technical Setups on USD/CAD, AUD/USD & Gold
- USD/CAD breaking below key pivot zone- initial support objective in view
- AUD/USD now testing key confluent resistance- breakout potential
- Gold breakout underway – initial resistance objectives in view
An update on technical setups we've been tracking in the Canadian Dollar, Australian Dollar and Gold. These are the targets and invalidation levels that matter heading into the close of the week. Review my latest Strategy Webinar for an in-depth breakdown of these technical setups and more.
Canadian Dollar Price Chart – USD/CAD 240min
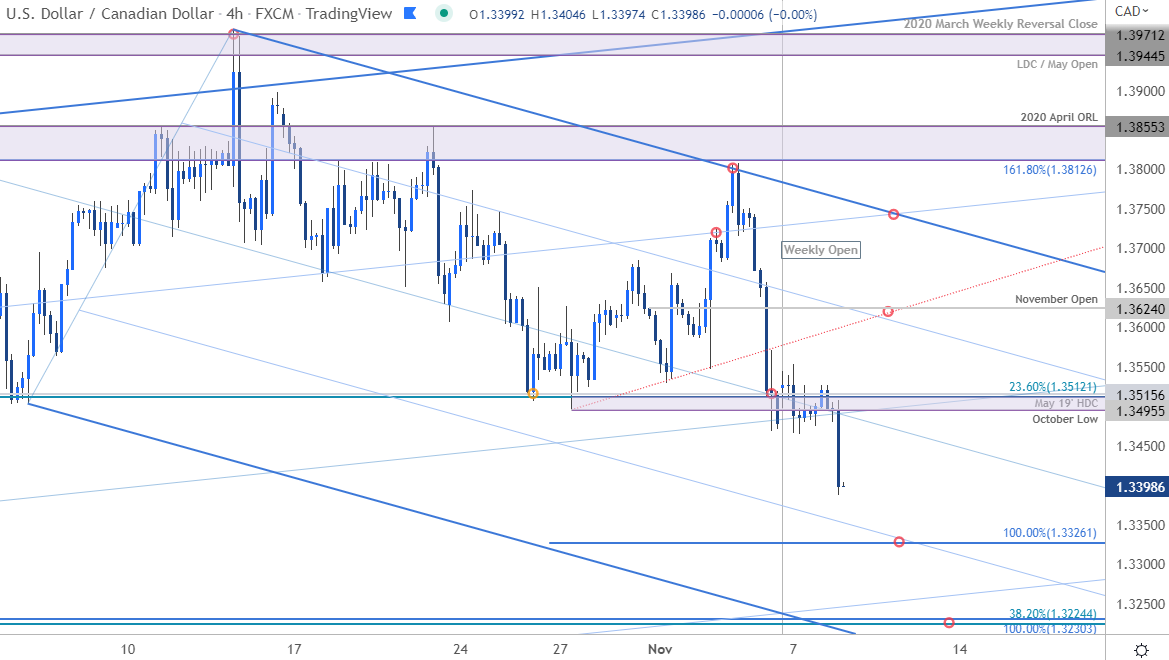
Chart Prepared by Michael Boutros, Technical Strategist; USD/CAD on Tradingview
Notes: In last month’s Canadian Dollar Short-term Outlook, I noted that USD/CAD, “responded to technical resistance and the focus is on this pullback within the broader uptrend. From at trading standpoint, rallies should be limited to the weekly open (1.3870) IF price is heading lower on this stretch- look for a larger reaction on a test of the 1.35-handle with a breakout of the October range to offer further guidance here.” Price registered a high at 1.3854 in the following day with the subsequent reversal breaking below support this week the 23.6% Fibonacci retracement of the 2021 rally / May 2019 high-week close and the October lows around 1.3495-1.3515.
The focus is on initial support at the 100% extension of the yearly October decline at 1.3326 with subsequent support objective eyed at 1.3224/30- look for a larger reaction there IF reached. Weekly open resistance stands at 1.3525 backed by the November open at 1.3624. Ultimately a breakout of this descending pitchfork is needed to mark resumption of the broader uptrend.
Bottom line: A break below key support at the October range lows threatens a larger correction in USD/CAD. From a trading standpoint, look to reduce portions of short-exposure / lower protective stops on test of 1.3326. Rallies should be limited to the monthly open IF price is heading lower on this stretch. Review my latest USD/CAD Weekly Price Outlook for a closer look at the longer-term Canadian Dollar technical trade levels.

Australian Dollar Price Chart – AUD/USD 240min
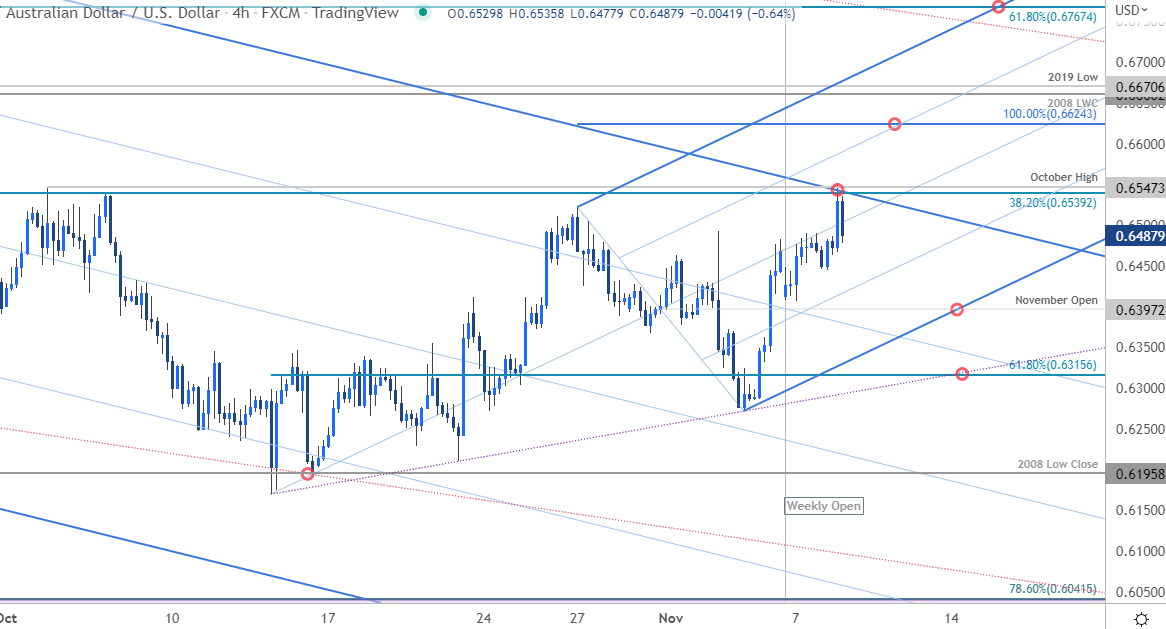
Chart Prepared by Michael Boutros, Technical Strategist; AUD/USD on Tradingview
In last week’s Australian Dollar Short-term Outlook, I noted that Aussie was testing the “last line of defense” at the October trendline- that level held with AUD/USD reversing sharply higher to mark the largest single-day advance since November of 2011. The rally extended into the weekly open with price now testing confluent resistance at the 38.2% retracement of the August decline / October highs at 6539/47- looking for a reaction here with a daily close above needed to keep the immediate long-bias viable.
Initial support rests with the monthly open at 6397 with broader bullish invalidation at the 61.8% retracement at 6315. A topside breach from here keeps the focus on the 100% extension of the advance at 6624 backed by the 2008 low-week close / 2019 low at 6660/70 and the 61.8% retracement at 6767.
Bottom line: Aussie has extended into confluent resistance. From at trading standpoint, a good zone to reduce long-exposure / raise protective stops- losses should be limited to the monthly open IF price is indeed heading higher on this stretch. Review my latest Australian Dollar Weekly Forecast for a closer look at the longer-term technical trade levels.
Gold Price Chart – XAU/USD Daily
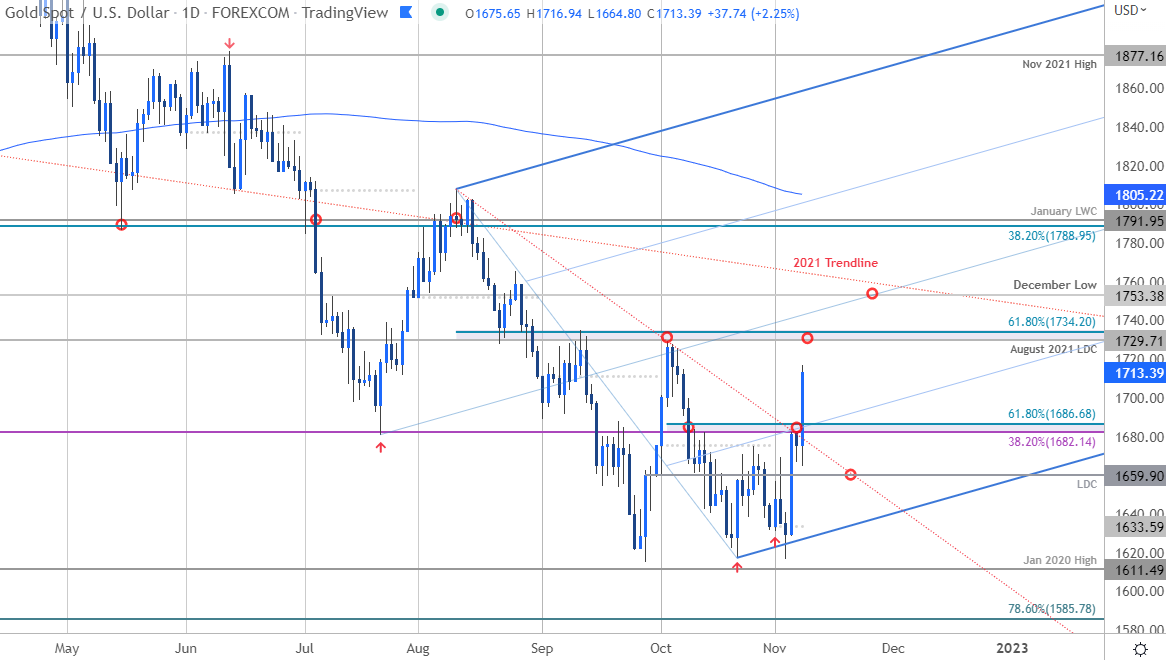
Chart Prepared by Michael Boutros, Technical Strategist; Gold on Tradingview
In last month’s Gold Short-term Technical Outlook I noted that the gold recovery was approaching a key pivot zone and that, “Ultimately, a breach / close above confluent Fibonacci resistance at 1682/86 is needed to suggest a larger reversal may be underway with such a scenario exposing the August low-day close / 61.8% retracement at 1729/34- look for a larger reaction there IF reached.” XAU/USD ripped through resistance today with the rally now within striking distance of the September / October highs around the 1682/86 objective.
Bottom line: A breakout of yearly trend resistance threatens a broader recovery in gold prices in the days ahead. From a trading standpoint, look to reduce long-exposure / raise protective stops on a stretch towards 1729/34 IF reached – ultimately a breach above the 38.2% retracement / January low-week close at 1788/91 would be needed to suggest a larger trend reversal is underway. Review my latest Gold Weekly Forecast to take a closer look at the longer-term XAU/USD technical trade levels.

For a complete breakdown of Michael’s trading strategy, review his Foundations of Technical Analysis series on Building a Trading Strategy
-Written by Michael Boutros, Technical Strategist with DailyFX
Follow Michael on Twitter @MBForex


