


British Pound Technical Price Outlook: GBP/USD Short-term Trade Levels
- Sterling technical trade level update – Daily & Intraday Charts
- GBP/USD rallies into 2022 downtrend resistance – weekly opening-range breakout imminent
- Resistance 1.1630/50, ~1.17, 1.1843 – Support 1.1305, 1.1151, 1.0998
The British Pound is virtually unchanged against the US Dollar since the start of the week with GBP/USD now testing yearly downtrend resistance. The battle lines are drawn heading into the close of the week and once again, the outlook for the recovery off record lows hangs in the balance. These are the updated targets and invalidation levels that matter on the GBP/USD technical charts. Review my latest Strategy Webinar for an in-depth breakdown of this Sterling setup and more.

British Pound Price Chart - GBP/USD Daily
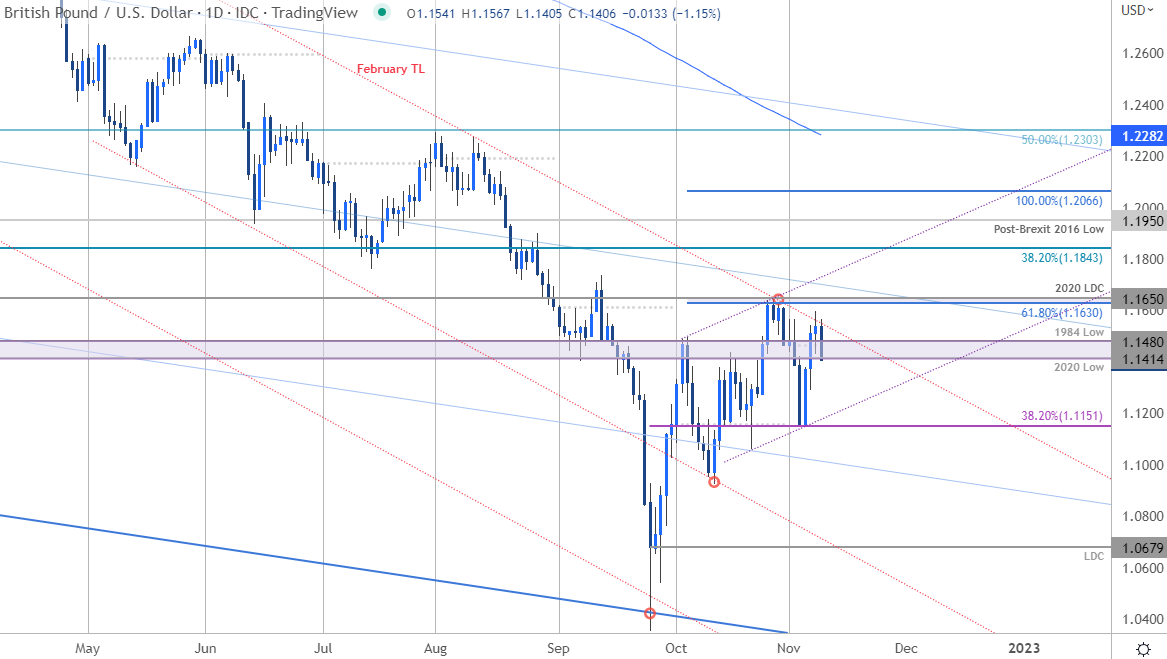
Chart Prepared by Michael Boutros, Technical Strategist; GBP/USD on Tradingview
Technical Outlook: In last month’s British Pound Short-term Technical Outlook, I noted that GBP/USD was trading just below, “resistance at 1.1414/80- look for the breakout. From a trading standpoint, losses should be limited to 1.1120 IF price is heading higher on this stretch..” Sterling ripped through resistance into the close of October before reversing off confluent resistance at 1.1630/50- a region define by the 61.8% Fibonacci extension of the September rally and the 2020 low-day close. Note that these levels converges on yearly downtrend resistance at the February trendline. The November opening-range is set just below this threshold with price straddling the 1.1414/80 zone for the past few days. Once again I’m looking for the breakout to further guidance here.
British Pound Price Chart - GBP/USD 240min
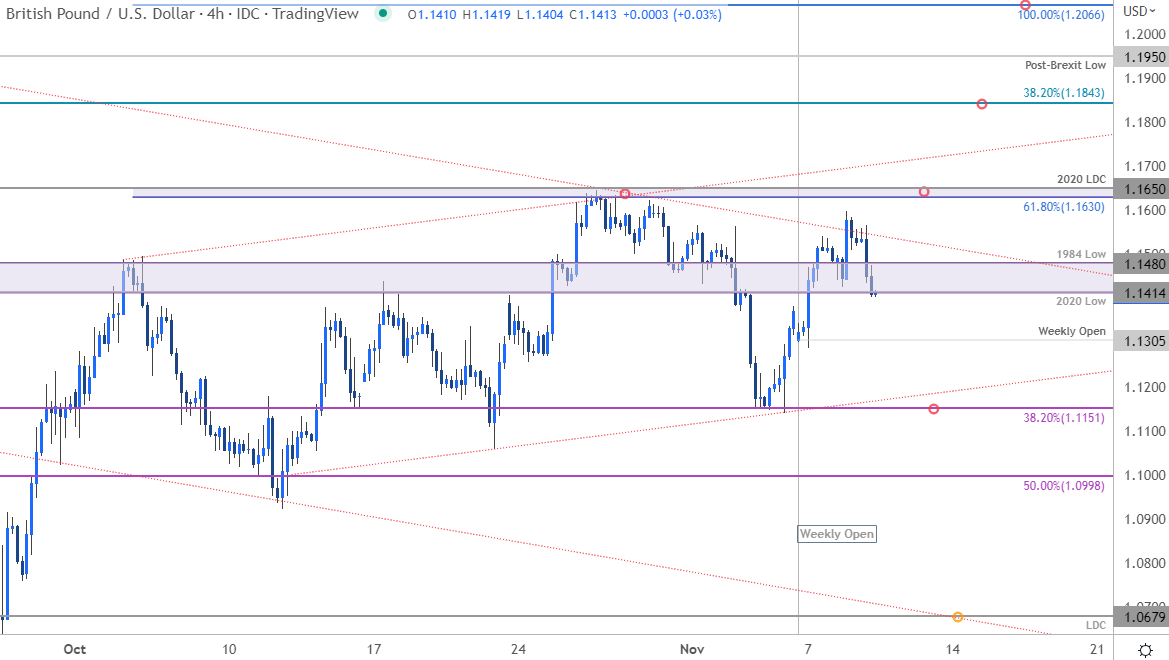
Chart Prepared by Michael Boutros, Technical Strategist; GBP/USD on Tradingview
Notes: A closer look at Sterling price action show GBP/USD trading within the confines of a short-term ascending channel formation (possible flag) with this week’s rally once again failing at year channel resistance. The weekly opening-range is set just below this slope.
Weekly open support rests at 1.1305 with near-term bullish invalidation now raised to the 38.2% retracement of the October rally at 1.1151. Resistance steady at 1.1630/50 backed by channel resistance (currently ~1.17) – a topside breach / close above this trendline would be needed to suggest a larger trend reversal is underway towards the 38.2% retracement of the 2021 decline at 1.1843.
For a complete breakdown of Michael’s trading strategy, review his Foundations of Technical Analysis series on Building a Trading Strategy
Bottom Line: Sterling is testing yearly downtrend resistance here with the weekly opening-range taking shape just below- the larger focus is on an eventual breakout of the 1.1151-1.1650 range for guidance. From a trading standpoint, losses should be limited to Friday’s low IF price is indeed heading higher on this stretch. Ultimately, a break of the monthly lows would threaten resumption of the broader downtrend towards 1.10 and the low-day close at 1.0679. Keep in mind we still have the US Consumer Price Index (CPI) on tap into the close of the week. Review my latest British Pound Weekly Forecast for a closer look at the longer-term GBP/USD technical trade levels.
British Pound Trader Sentiment - GBP/USD Price Chart
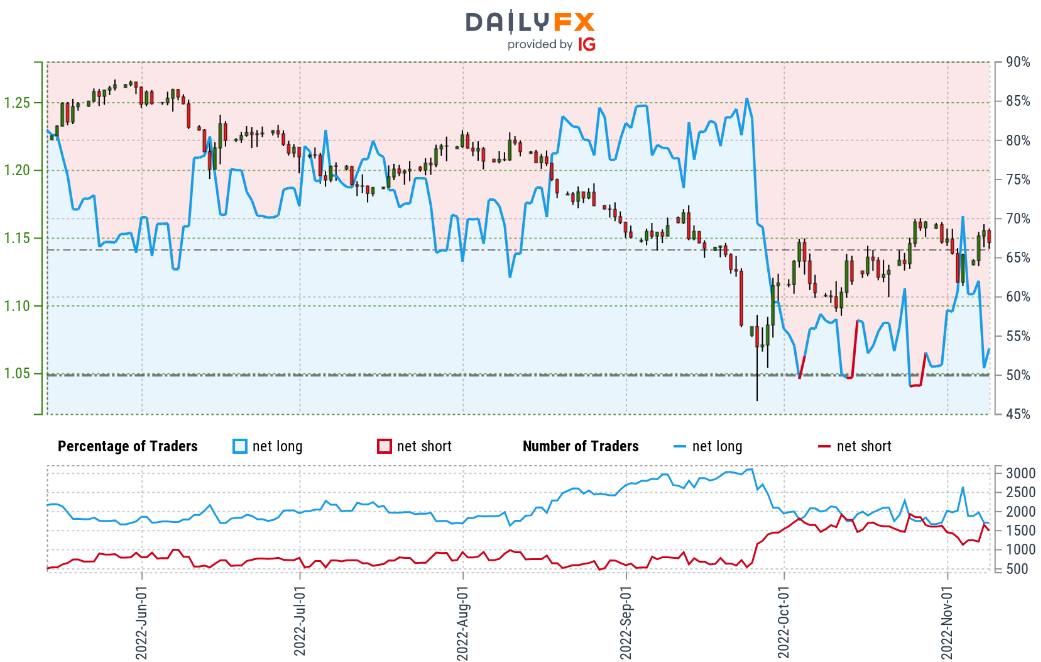
- A summary of IG Client Sentiment shows traders are net-long GBP/USD - the ratio stands at +1.37 (57.73% of traders are long) – typically weak bearish reading
- Long positions are 3.41% higher than yesterday and 3.09% lower from last week
- Short positions are 13.28% lower than yesterday and 13.88% lower from last week
- We typically take a contrarian view to crowd sentiment, and the fact traders are net-long suggests GBP/USD prices may continue to fall. Traders are further net-long than yesterday and last week, and the combination of current positioning and recent changes gives us a stronger GBP/USD-bearish contrarian trading bias sentiment standpoint
| Change in | Longs | Shorts | OI |
| Daily | 3% | -7% | -3% |
| Weekly | 4% | -10% | -5% |
UK / US Economic Calendar
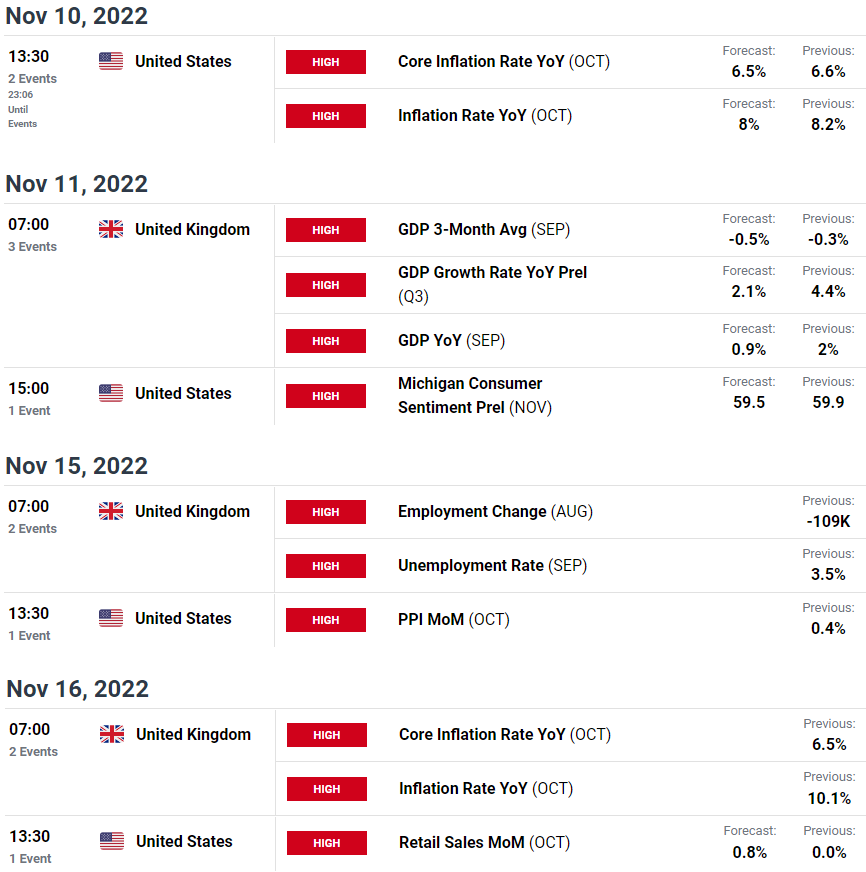
Economic Calendar - latest economic developments and upcoming event risk.
Active Technical Setups
- USD/CAD AUD/USD & Gold Technical Trade Setups
- Australian Dollar Short-term Outlook: AUD/USD at Last Line of Defense
- Gold Price Short-term Outlook: Gold Rally Tests Key Pivot Zone
- Euro Short-term Technical Outlook: EUR/USD Pops Parity- ECB on Tap
- Crude Oil Short-term Technical Outlook: WTI Breakout Imminent
- GBP/USD, USD/CAD & S&P 500 Technical Trade Setups
Foundational Trading Knowledge
Forex for Beginners
New to Forex Trading? Get started with this Beginners Guide
--- Written by Michael Boutros, Technical Strategist with DailyFX
Follow Michael on Twitter @MBForex


