


US Dollar Technical Forecast: Neutral
- The USD started a bullish move with a test above range resistance but was quickly slammed back-down on Friday after the release of a disappointing Services PMI report. This data point showed the lowest read since March of 2020 and was expected at 55 but instead came in at 49.6 (readings below 50 indicating contraction).
- Next Thursday brings the December CPI report to markets and inflation has been the big driver of late. Expectations are for continued softening with inflation forecast to come in at 6.5% for headline CPI and 5.7% for Core CPI.
- The analysis contained in article relies on price action and chart formations. To learn more about price action or chart patterns, check out our DailyFX Education section.

After closing out a year of heavy trends, in both directions, the US Dollar limped into 2023 trade holding a two-week range. But perhaps more interesting than the mean reversion itself was the context, as the range had built after a back-breaking sell-off in Q4 that erased more than 50% of the move that started to build from the lows in January of 2021. What took 21 months to build was half-erased in three months. And that led to the back-and-forth price action in the USD as we opened 2023 trade.
With Fed policy firmly in a hawkish position and with the US economy still showing strength, the pathway appeared to lead to higher rates from the Fed as the bank continues to try to tackle inflation; and with economic vulnerability in Europe and the UK, this could further make the USD as an attractive venue on the back of that shifting theme.
We saw extension of that move in early-Friday trade, helped along by a mixed bag of an NFP report. The unemployment rate dropped back down to 3.5%, which is a bullish factor for the US labor market and in-turn, viewed as a hawkish factor for the Fed. But – on the inflation aspect of that report, Average Hourly Earnings disappointed, coming in at 4.6% versus a 5% expectation, so this offset that falling unemployment rate to a degree, at least from a fundamental perspective.
The market reaction was less mixed as USD strength and equity weakness showed in the immediate aftermath of Non-farm Payrolls.
But then another factor came into the equation. ISM Non-manufacturing PMI was released at 10 AM and came out with its lowest reading since March of 2020. This was expected to print at 55 but instead came in at 49.6. This data point coming in below 50 indicates contraction, which caught many by surprise. This shows that the Fed’s rate hikes are having an impact on the economy and with PMI considered a leading indicator, that impact is perhaps far greater than what many are expecting, the Fed included. The immediate reaction was a fast erasing of prior USD gains as the currency fell back into its prior range, with equities ramping-higher.
At this point, the US Dollar is crawling back towards long-term support, which I’ve plotted on the below chart as the range between 2017 and 2020 swing highs.
US Dollar Weekly Price Chart
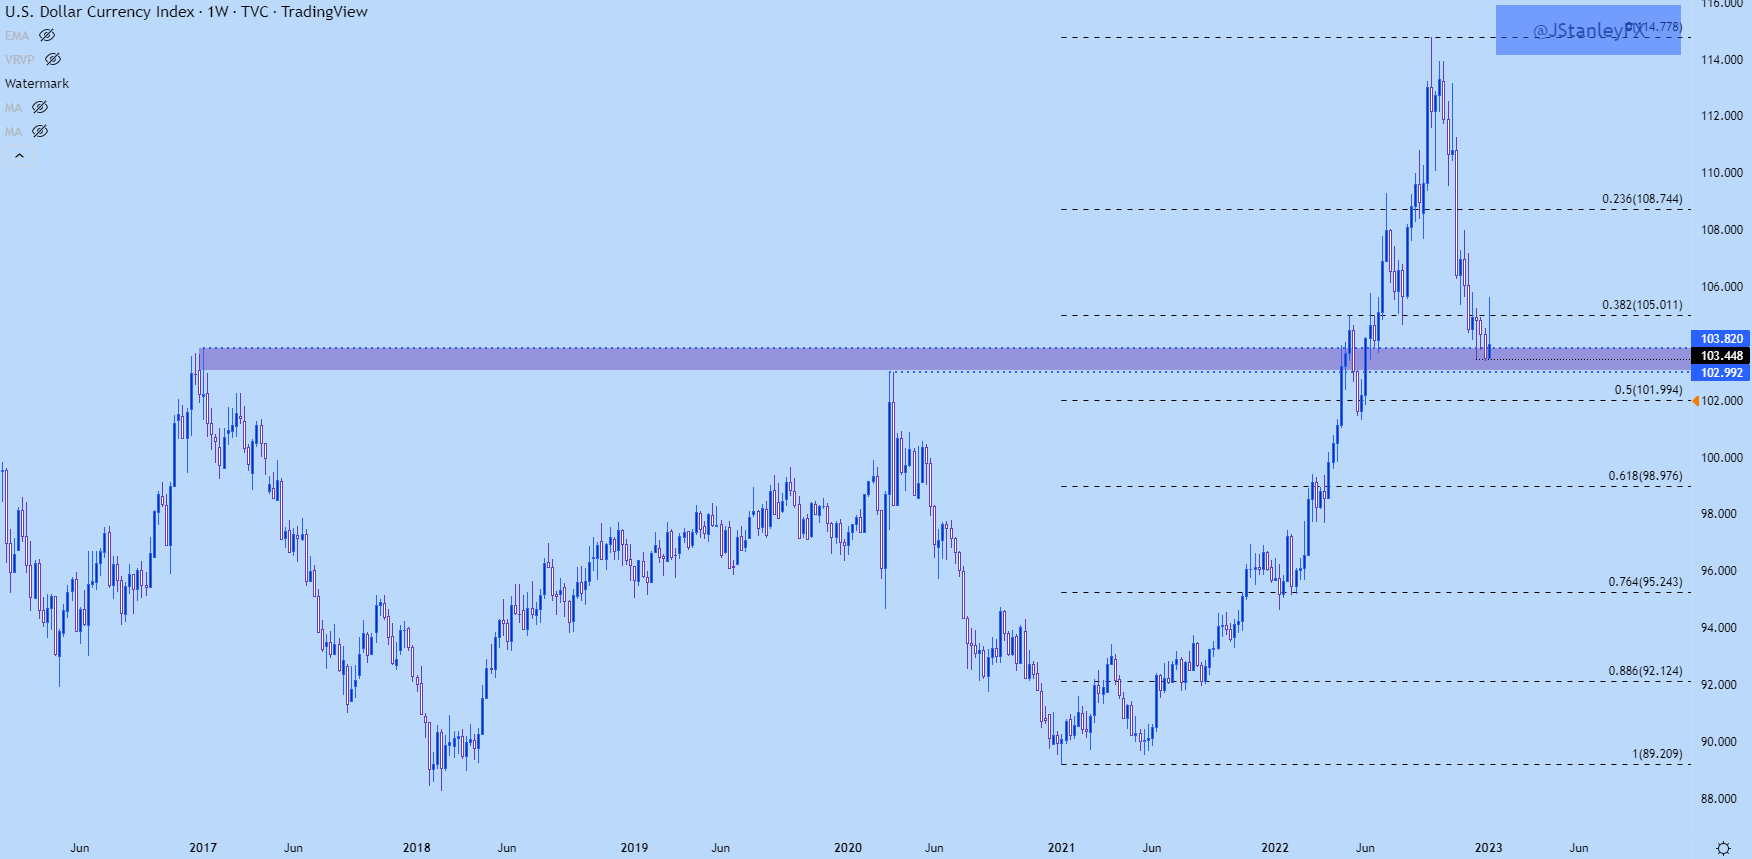
Chart prepared by James Stanley; USD, DXY on Tradingview
USD Range Support
Given the massive reaction on Friday, the DXY daily bar is working on a bearish engulfing formation, as of this writing. That’s usually a strong signal of momentum and can often have carry-through as the engulfing formation itself is often tracked with the aim of a momentum change.
So, while the fundamental picture appears to be USD-positive, the technical picture isn’t quite so clear as a completion of the engulf formation puts the ball back in bears’ courts, with the following question thereafter whether sellers can drive below the 103.45 level that held the 2022 swing low on two separate occasions.
And if sellers can break that level, for how long can they run? The USD was already flashing oversold values from a number of vantage points, and there’s another support level a little lower, around the 103 level, which was the panic high from March of 2020.
US Dollar Daily Chart
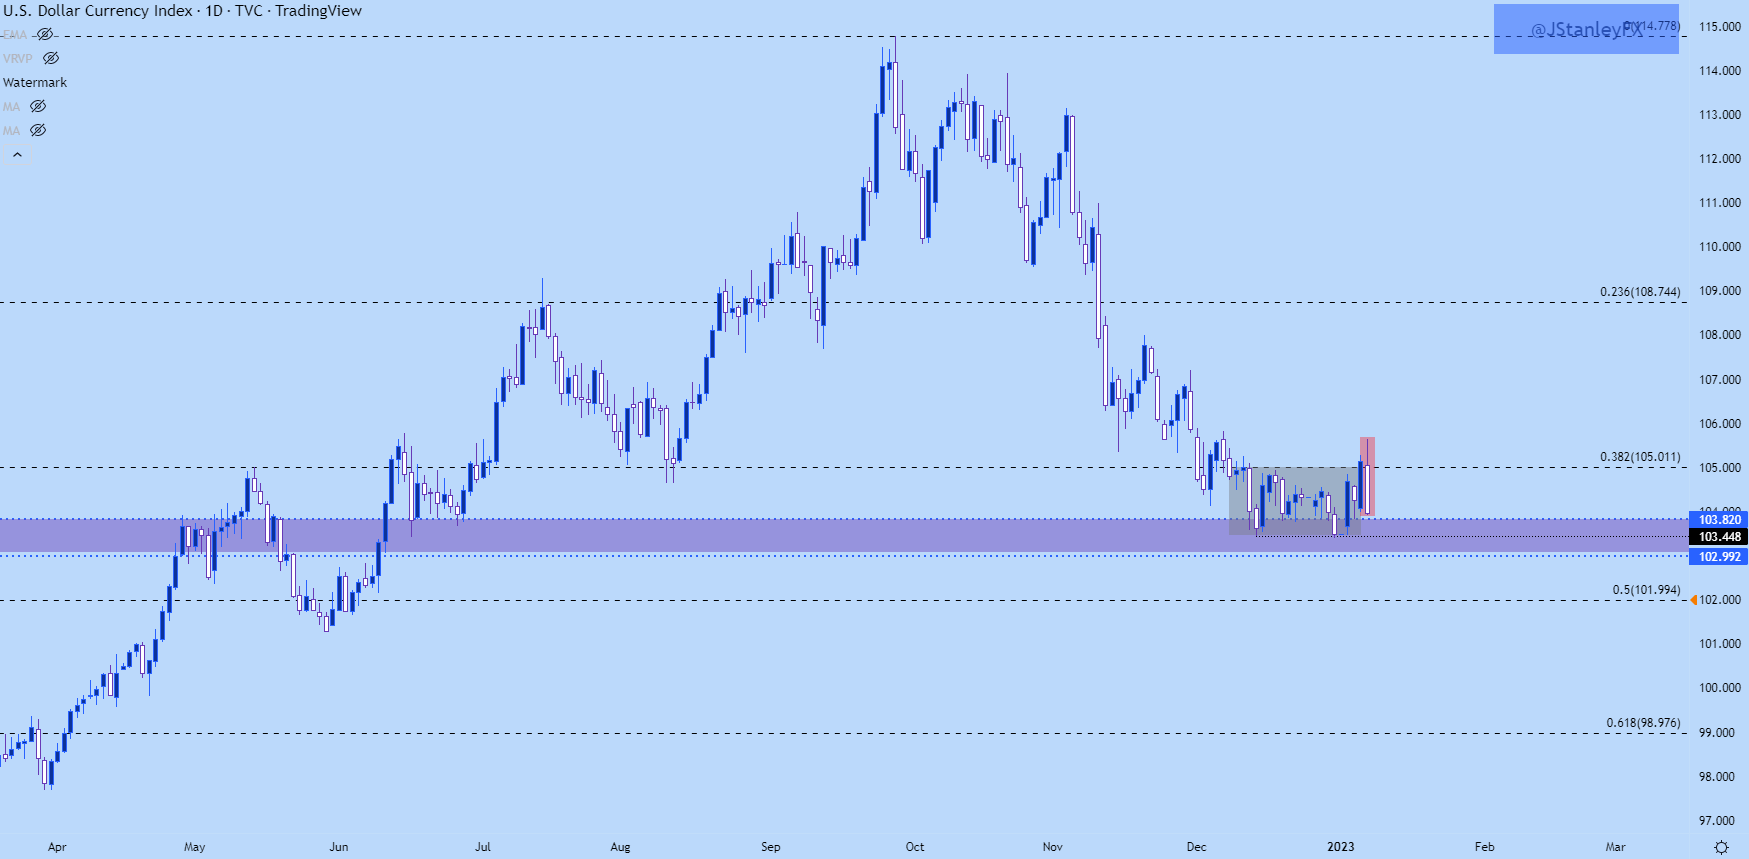
Chart prepared by James Stanley; USD, DXY on Tradingview
USD Capitulation Low, EUR/USD Capitulation High?
For next week, the big question is how USD bulls respond to another support test in this zone that held the lows for three weeks. The price of 103.45 came into play after the CPI report and FOMC meeting in December, and it held the lows again in on the final trading day of the year, which makes this price the 2022 close.
But what happens if sellers can elicit a quick break of that price early next week? Will more sellers suddenly show up that were noticeably absent while the range was building after the Q4 sell-off?
I’m more interested in the prospect of finding a capitulation low in that scenario, particularly if it can happen around the Thursday CPI report. This would be like what showed in the S&P 500 in October, when the CPI report triggered a fresh bearish breakout that was quickly snapped back, with the index quickly moving back into a bullish trend reversal after that.
So, the USD is not yet bullish and the bearish engulf on the daily chart illustrates that. But there may be a bullish backdrop around the corner and for this scenario to play out, it’ll need some help from the Euro.
EUR/USD
EUR/USD started 2023 trade with a breakdown, and this was the first lower-low that had printed on the daily chart since the pair bottomed in September.
Support soon showed up at a trendline projection and this held the low on Tuesday. A Wednesday bounce was faded on Thursday and, again, support showed at this trendline projection, around the 1.0517 level.
On Friday, after the NFP report, sellers were starting to make some ground, but they couldn’t get very far below the 1.0500 psychological level and then that’s when the PMI report helped to bring a strong reversal of that theme. This has helped EUR/USD to push right back up to resistance at 1.0636, which was the 2020 swing low in the pair. The daily bar is currently showing a bullish engulfing formation which is generally tracked for continuation potential in that direction.

EUR/USD Daily Price Chart

Chart prepared by James Stanley; EURUSD on Tradingview
EUR/USD Bigger Picture
Taking a step back, we can see an extended underside wick on the weekly chart, and this is generally not something that I would want to look to take on short exposure with. That wick illustrates a strong reversal and given that it was pushed by economic data, that may be a theme that has some continuation potential. And adding in another technical factor, the daily bar finishing as a bullish engulf further enforces that possibility.
But, like support on DXY above, resistance in EUR/USD is at a rather imposing place on the chart, and this raises the possibility of a bullish breakout to a fresh high that may open the door for reversal or fade setups in the pair. The next spot of resistance that I’m tracking in EUR/USD is a zone that runs from the 1.0750 psychological level up to the 1.0778 prior swing high.
EUR/USD Weekly Chart

Chart prepared by James Stanley; EURUSD on Tradingview
GBP/USD
The British Pound has struggled when compared to the Euro of late and this is illustrated in the juxtaposition of GBP/USD against EUR/USD. While EUR/USD is not very far off from a fresh high, GBP/USD remains ensconced in a slightly more bearish backdrop.
But, like EUR/USD, the pair is showing a bullish engulf formation, and this happened after a test of a key Fibonacci level. The price of 1.1843 is the 38.2% retracement of the 2021-2022 major move. That price helped to set the low before a strong bullish move drove prices right back to resistance at 1.2105. I had highlighted that level in yesterday’s USD Price Action piece as a decision point for bears, which has since held as support.
This may be a bit more attractive, at least at this stage, for USD-strength scenarios but, notably, bears should remain cautious if the bullish engulf confirms. The big question for next week is how much continuation may follow, and that puts focus back on resistance at the 1.2223 level.

GBP/USD Daily Price Chart

Chart prepared by James Stanley; GBPUSD on Tradingview
USD/CAD: Shifting Tides
I talked about this on Thursday which extended a topic that I began to broach on Tuesday, which is the shifting dynamic in USD/CAD.
For the second half of Q4, the Canadian Dollar was one of the few global currencies that was weaker than the USD. This is well illustrated by the purple box on the below chart, when USD/CAD rallied from 1.3250 up to the 1.3700 handle.
But 1.3700 is where matters got messier; and bulls just could not break-through. CAD started showing a bit more strength and this week, even when USD was breaking out of the range ahead of the PMI report on Friday, USD/CAD was lagging, indicating that CAD-strength. And then when USD reversed, USD/CAD plunged, highlighting how that weak USD theme was well-matched with a strong Canadian Dollar.
This puts USD/CAD in an attractive spot for those looking at USD-weakness scenarios. Or, alternatively, a strong CAD can be voiced elsewhere, such as bearish EUR/CAD or GBP/CAD setups.
In USD/CAD, my next support is at the 1.3338 level, after which the 1.3250 psychological level comes back into the picture.

USD/CAD Daily Chart
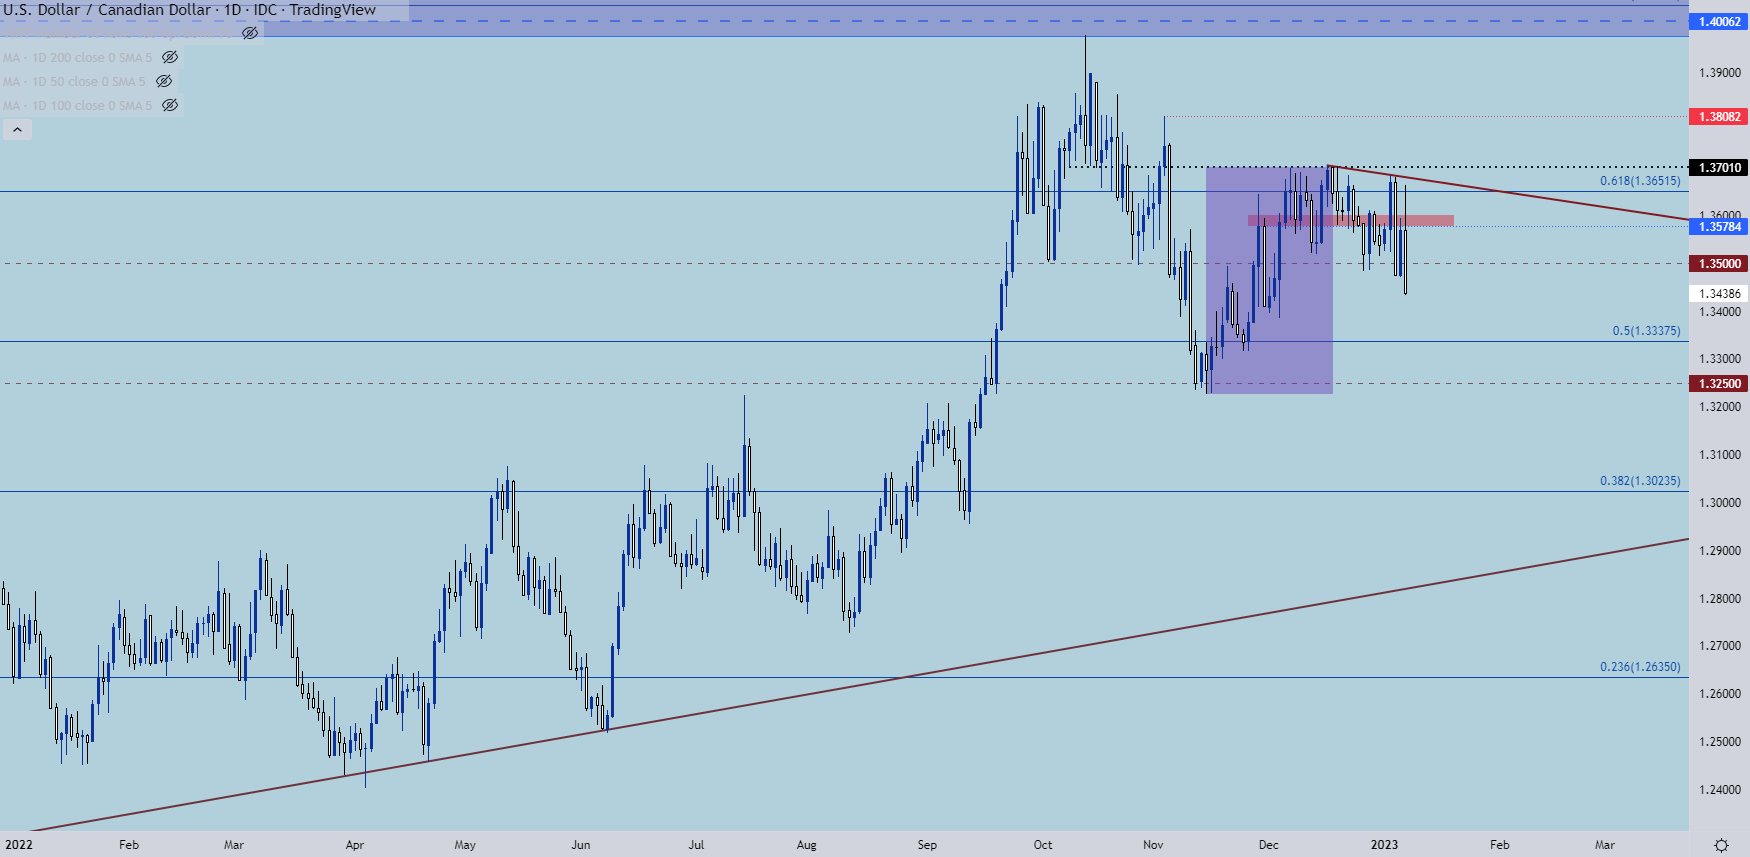
Chart prepared by James Stanley; USDCAD on Tradingview
USD/JPY
USD/JPY put in a strong reversal last quarter, falling from above the 150 handle all the way down towards the 130 level. That psychological level began to come into play this week, helping to set a low as a falling wedge formation built. And when USD-strength was running high going into Friday morning, the pair had already broken out and pushed up to the ‘r3’ level that I had talked about on Tuesday. That price is simply a spot of support-turned-resistance at 134.45 and, as bulls soon found out, it was a rigid level of resistance.
Prices in USD/JPY have already snapped back and sellers didn’t stop at a support test of the prior ‘r2’ level. This puts focus back on the 131.25 spot which, for next week, becomes confluent with the topside of the falling wedge formation.
This keeps the door open for higher-low support, which would simply need to hold above the 130.00 level to keep the door open for bullish reversal scenarios.

USD/JPY Four-Hour Price Chart

Chart prepared by James Stanley; USDJPY on Tradingview
--- Written by James Stanley
Contact and follow James on Twitter: @JStanleyFX


