


US Dollar Talking Points:
- The USD has started the year with a spurt of strength. The big question, of course, is whether the bullish trend that dominated in the first nine months of last year takes back over, or whether the searing sell-off of Q4 continues into 2023 trade.
- The highlight for this week’s US economic calendar is the NFP report scheduled for Friday, but tomorrow brings Manufacturing PMIs and FOMC minutes from the December rate decision.
- The analysis contained in article relies on price action and chart formations. To learn more about price action or chart patterns, check out our DailyFX Education section.

The US Dollar has started the year with a quick spurt of strength, begging the question as to whether the USD sell-off that enveloped FX markets in Q4 is preparing to turn. There is some workable US data this week, with tomorrow bringing Manufacturing PMI numbers followed by FOMC meeting minutes. Friday is really the more interesting setup for USD markets, however, as NFP is released at 8:30 and this is followed by Services PMI at 10 AM ET. Earlier on Friday morning we also get Euro inflation data from the month of December, expected to come in at 9.7% with core expected at 5% even.
For the Greenback, the stage is set after a bifurcated year of price action in 2022. The first nine months of the year saw the USD take-on a historic bullish run, eventually setting fresh 20-year-highs in September. But, Q4 saw more than 50% of that move get erased as prices aggressively pulled back. This was driven by a combination of the Bank of England and European Central Bank getting more hawkish with policy, but also by markets starting to price-in a softening in rate hikes out of the US. With the Fed’s 50 bp hike in December, that’s already started to a degree, but the big question is for how long the FOMC might continue to hike in 2023 and that will likely be dictated by inflation and employment data, such as the NFP report that we’ll see on Friday morning.
The USD remains at a key juncture on the chart, holding above a bullish trendline and around a zone of prior resistance. The 2017 swing high was at 103.82 and the 2020 swing high was down at 103.45. The area between those two levels has now held the low for three weeks with this week marking the fourth week of support tests in this area.
US Dollar Weekly Price Chart
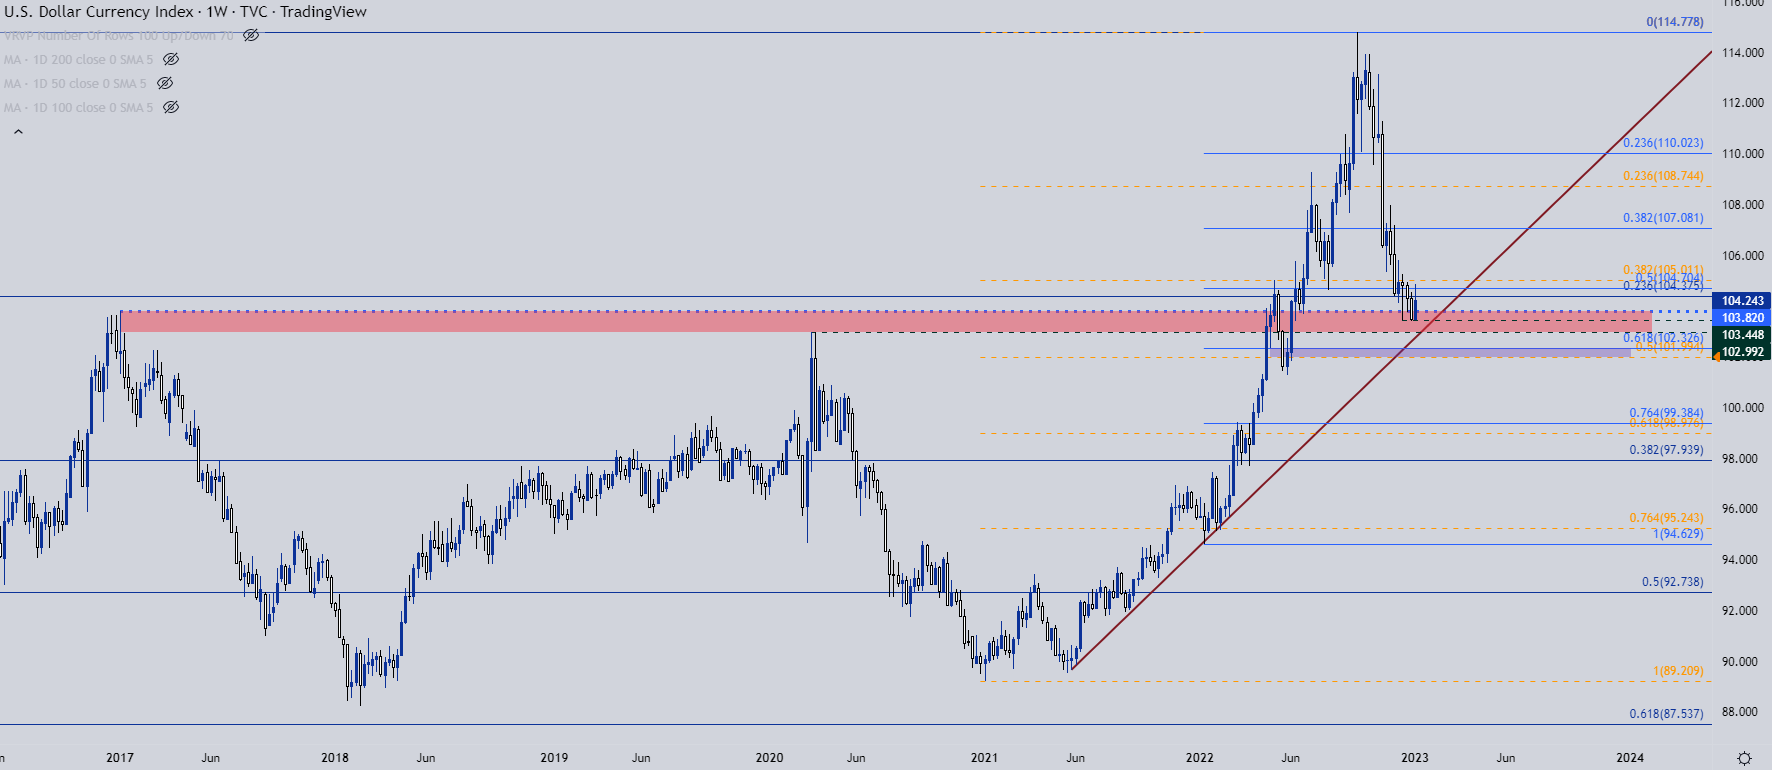
Chart prepared by James Stanley; USD, DXY on Tradingview
USD Shorter-Term: DXY 105
On a shorter-term basis, the 105.00 level is a key spot for USD bulls if they want to re-take control of DXY price action. This is the 38.2% Fibonacci retracement of the 2021-2022 major move. The price of 105 is also a psychological level that had helped to set resistance in May and June of last year before showing as support in August.
More recently, there was a build of resistance around this spot in early-December trade. If buyers can force a push above that level, the door would open to a larger bullish move, indicating that low, even if only a temporary one, is in-place in that confluent zone of support looked at above.
US Dollar Daily Price Chart
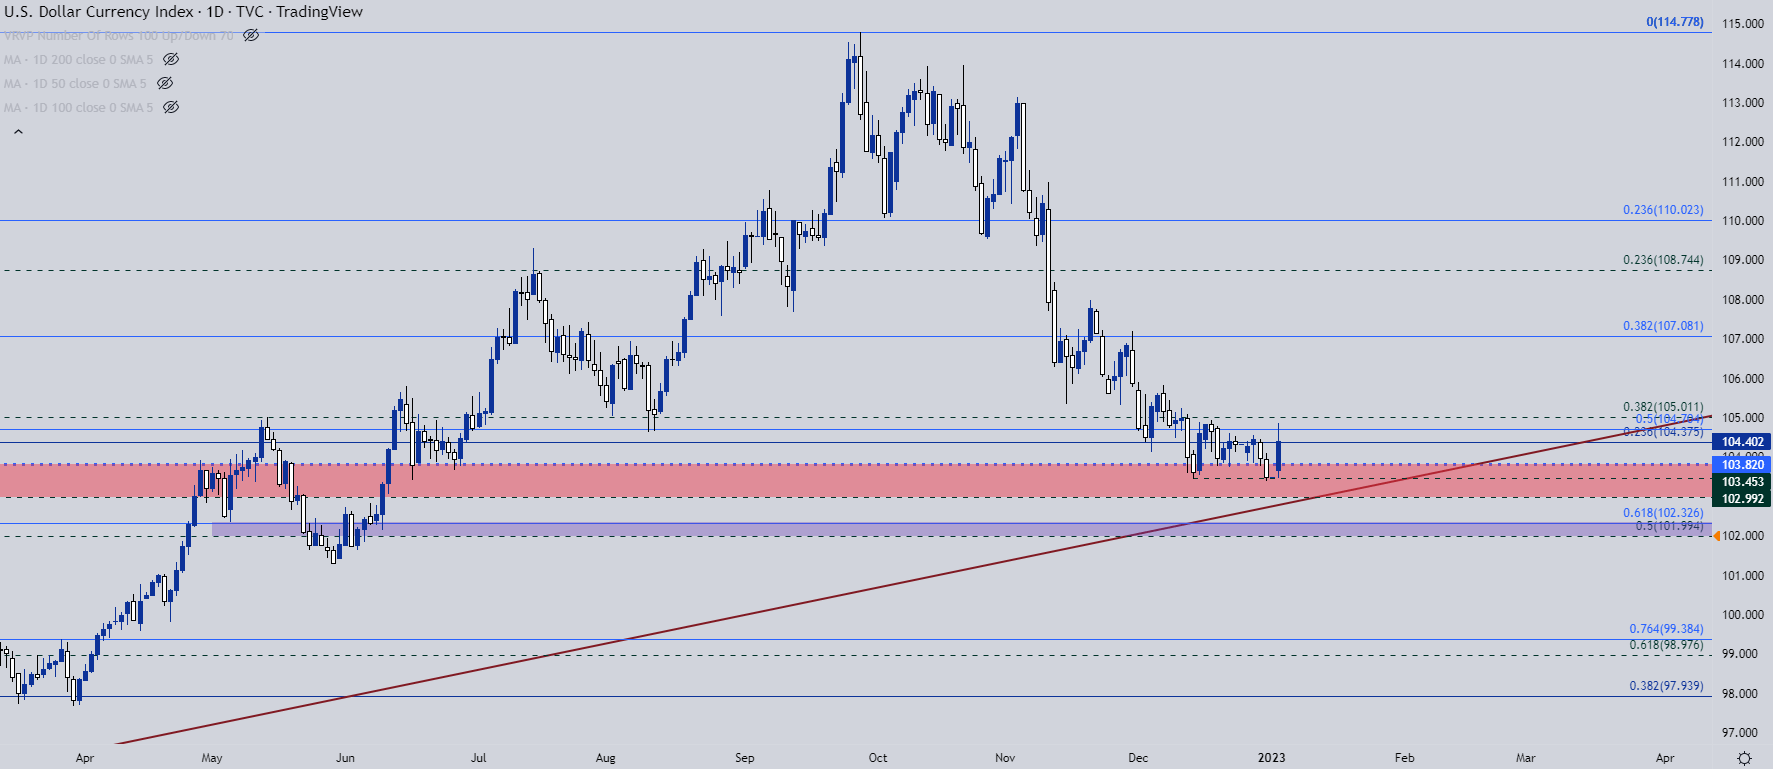
Chart prepared by James Stanley; USD, DXY on Tradingview
EUR/USD
The year started with a bit of excitement for EUR/USD and it was pretty much the exact opposite of how the pair had ended 2022. EUR/USD put in a topside breakout of the two-week range ahead of year-end. But, after opening up for 2023, price took a dip, eventually finding support at a trendline projection that connects June 2021 and February 2022 swing highs.
That projection helped to catch the low this morning and has led to a bounce in EUR/USD.
EUR/USD Daily Price Chart
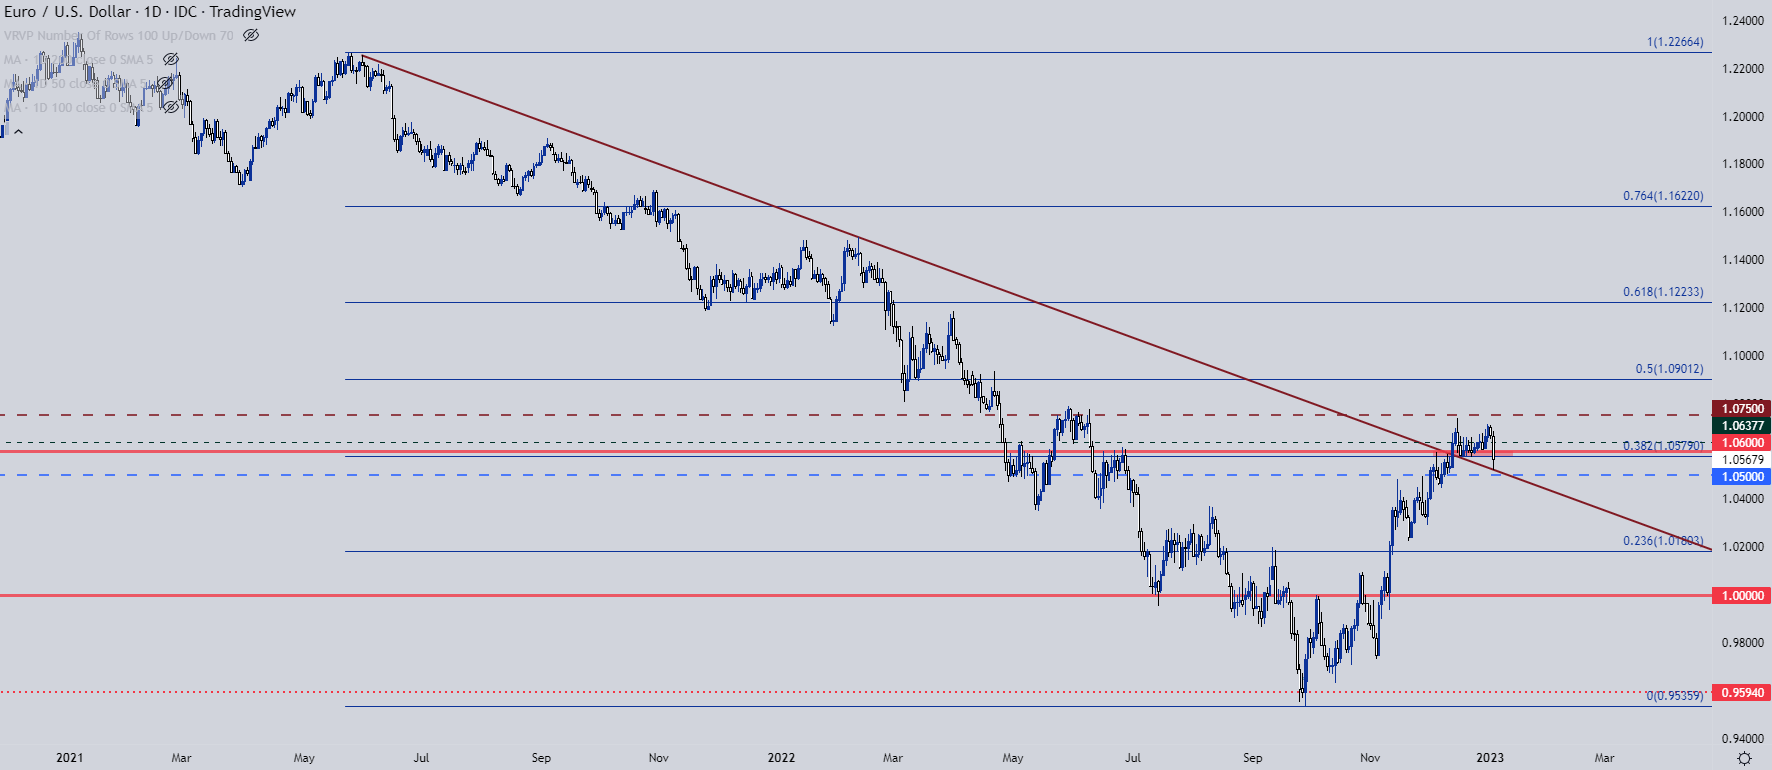
Chart prepared by James Stanley; EURUSD on Tradingview
EUR/USD
The push down to support this morning marked a fresh two-week-low in EUR/USD. But, perhaps more importantly, it showed a change in the sequence of higher-highs and higher-lows that had largely held since early-November, before the pair embarked on its bullish bounce above the parity handle.
The ECB rate decision was in the middle of December and that produced a bearish engulfing formation on both the four-hour and daily charts and since, the high hasn’t been taken out. This morning marks the first push down to a fresh lower-low.
And the bounce from that move has since held resistance at prior support, keeping the door open for a lower-high that points to continued bearish potential in the pair.

EUR/USD Four-Hour Price Chart
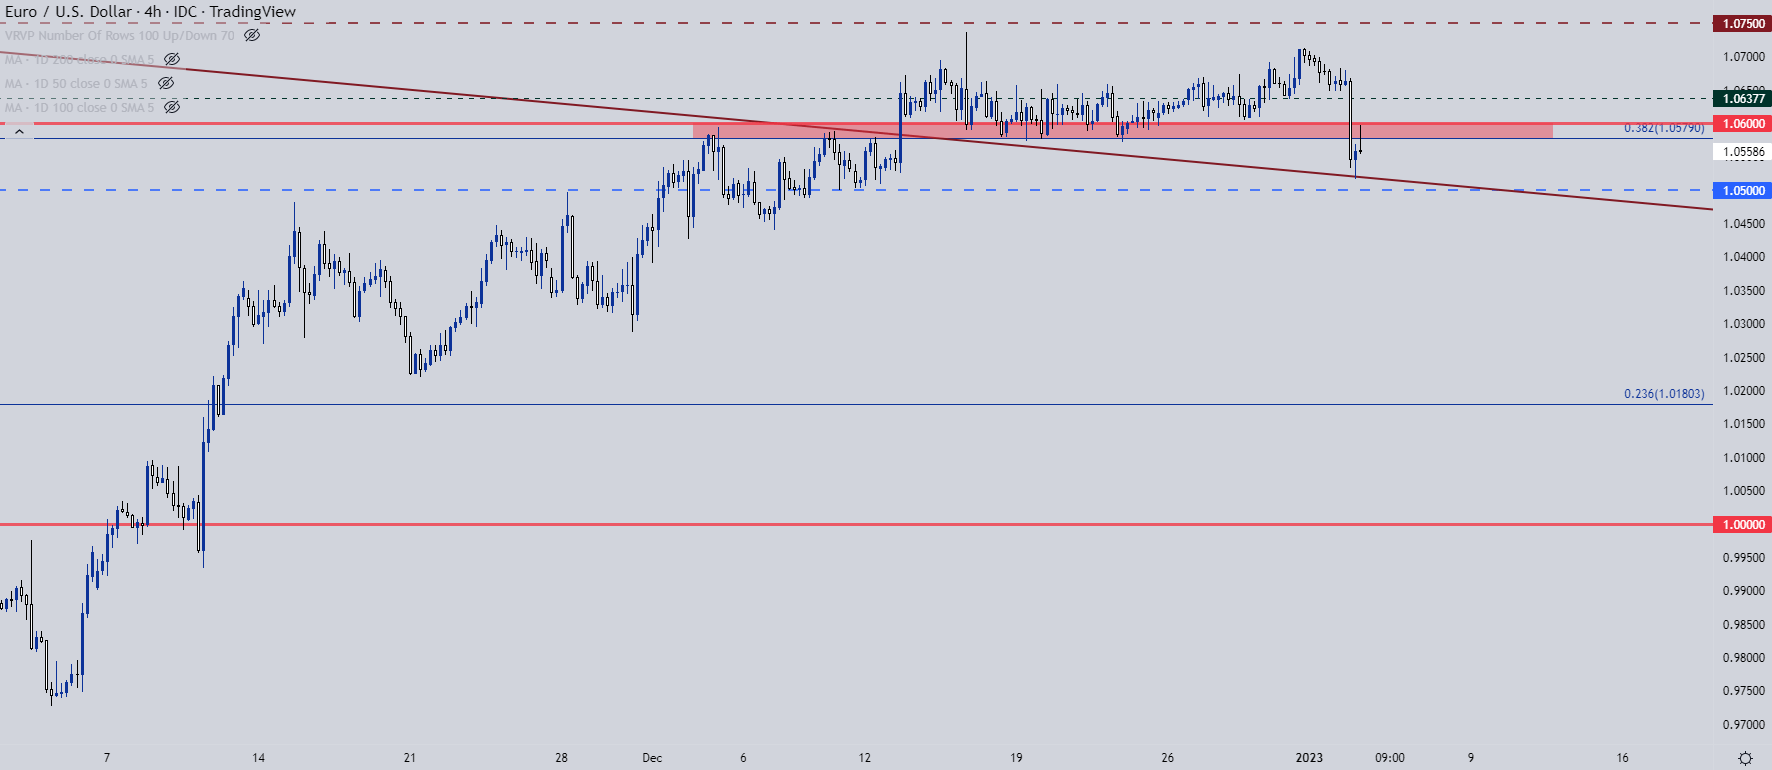
Chart prepared by James Stanley; EURUSD on Tradingview
GBP/USD
I think Cable may be a bit cleaner than EUR/USD at the moment.
The Q4 retracement in the USD matches with a strong bounce in GBP/USD over the same period of time. Resistance played-in on GBP/USD at a key spot, right at the 50% mark of the 2021-2022 sell-off at 1.2303. This level held the highs for three weeks until sellers finally started taking a stronger role, helping to push price down to 1.2000 and, as of this morning, a first breach back-below the big figure.
GBP/USD Weekly Price Chart
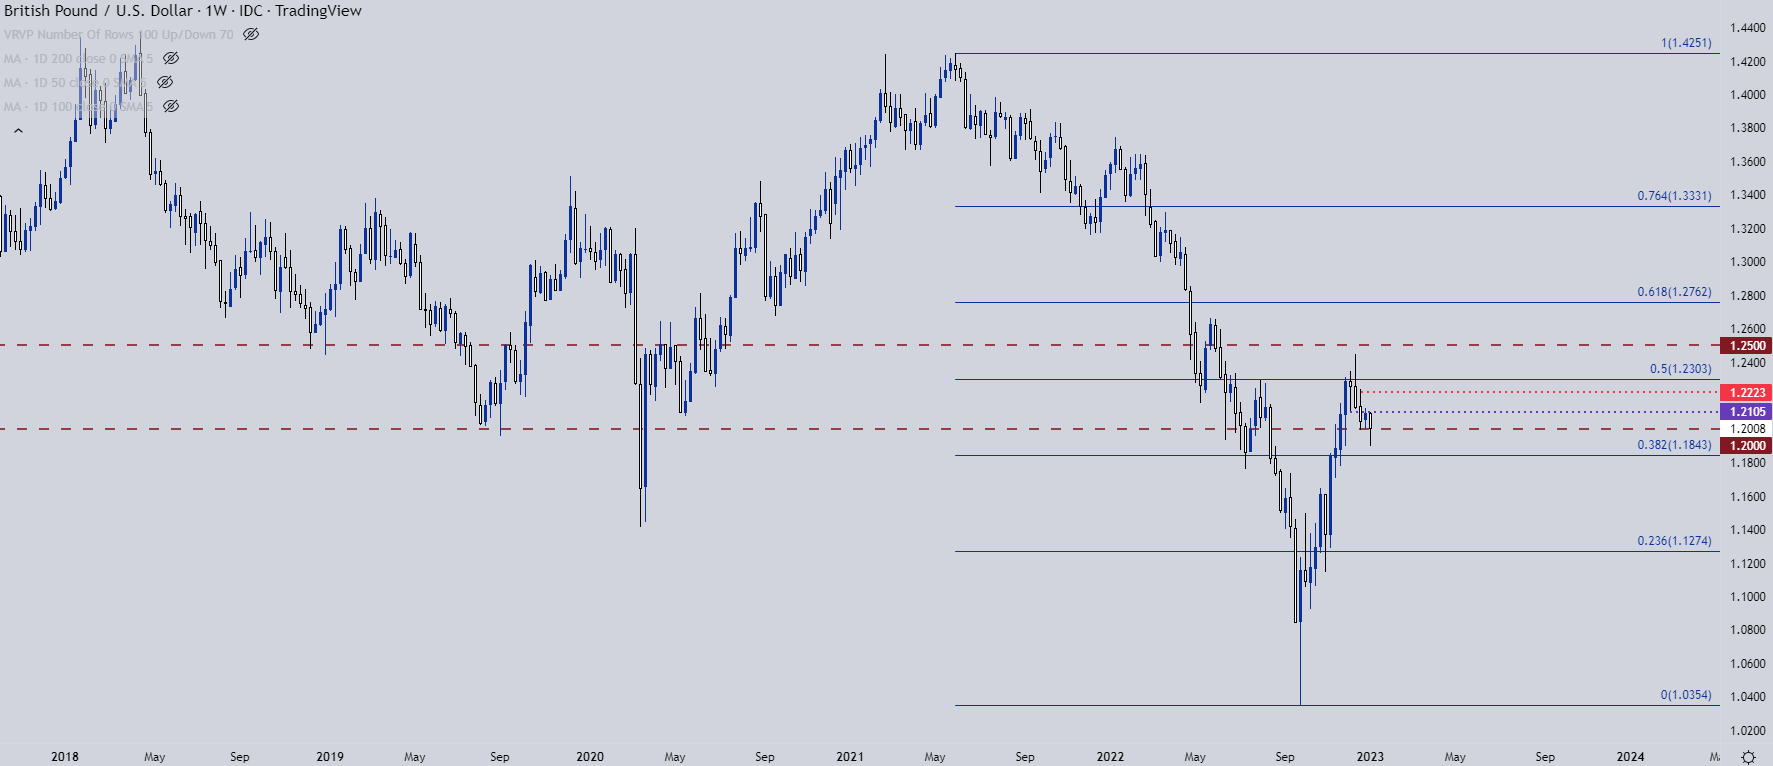
Chart prepared by James Stanley; GBPUSD on Tradingview
GBP/USD Shorter-Term
GBP/USD had started to display ranging tendencies on a short-term basis over the prior two weeks. First was support at 1.2105 and resistance at 1.2223, after which support showed at the 1.2000 handle with resistance at prior support of 1.2105.
This morning saw prices push down to the 1.1900 handle, after which another bounce has developed with resistance playing-in off of the 1.2000 level. With a fresh lower-low, the look now is on a lower-high and this would need to print inside of that prior spot of resistance as taken from previous support, around the 1.2105 level.

GBP/USD Four-Hour Price Chart
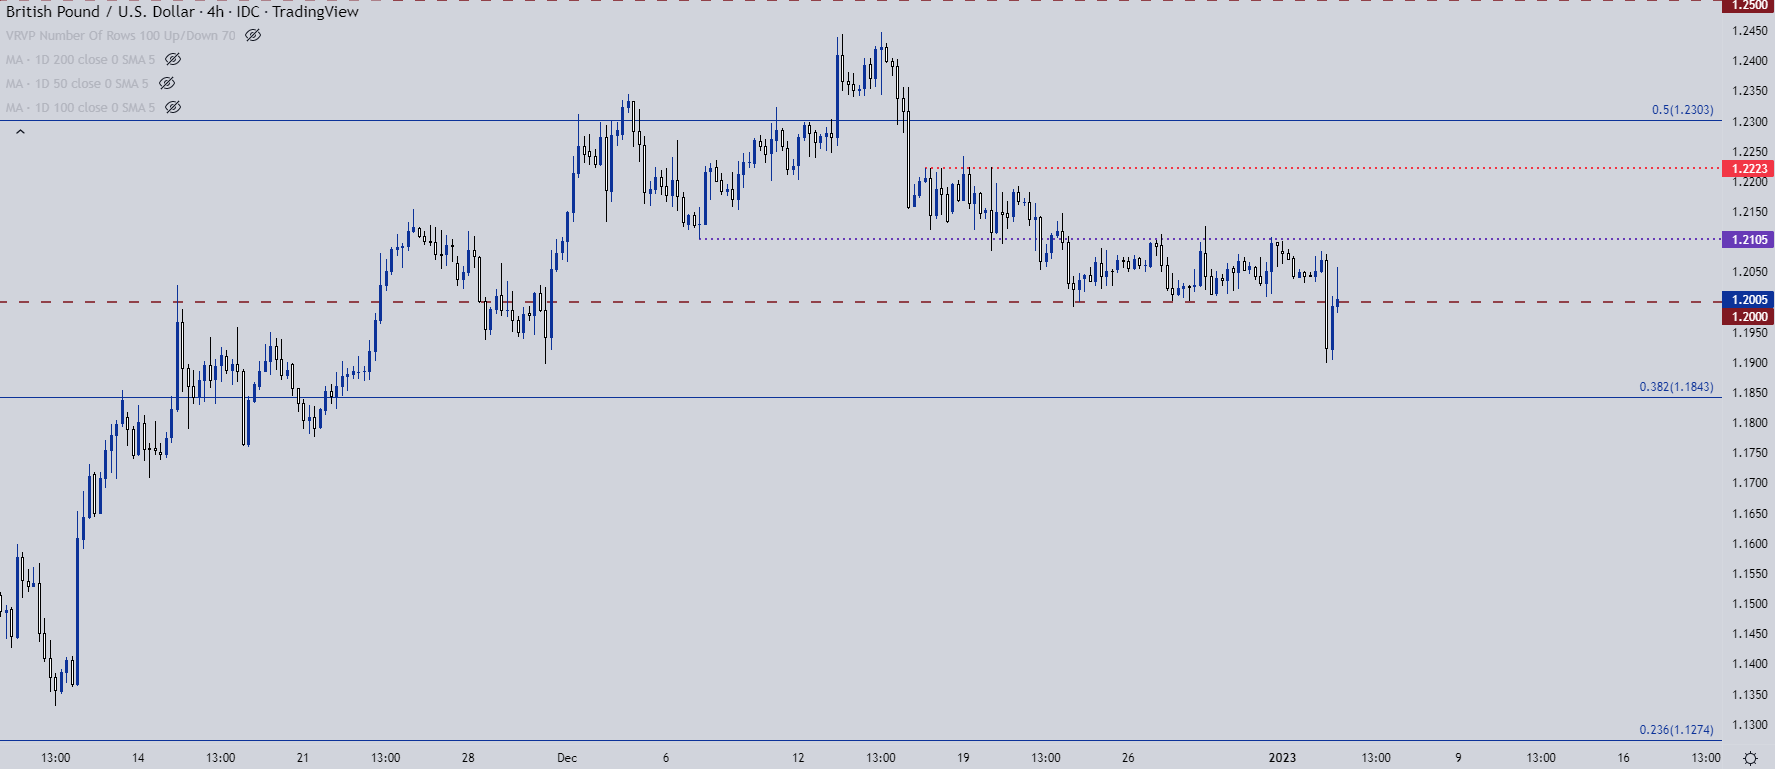
Chart prepared by James Stanley; GBPUSD on Tradingview
USD/CAD Shift
USD/CAD was one of the more attractive areas for working with USD-strength at multiple points last year. A weak Canadian Dollar, meshed up with a strong US Dollar, made for some pretty profound trends. But, those scenarios shift and there may be on showing at the moment.
While EUR/USD and GBP/USD have both punched down to fresh lows, USD/CAD has not been able to show a similar test of highs. This illustrates some CAD-strength to go along with that spurt of USD strength to start the week (and the year).
I had looked into USD/CAD last week to highlight the early stages of this shift and it’s continuing again today, with a lower-high inside of the 1.3700 resistance that had held so well through December. And technically, last week’s test of 1.3500 was a lower-low, so a lower-high hold can keep the door open for bearish scenarios in USD/CAD, with an initial support at 1.3578 after which the 1.3500 psychological level comes back into the picture.
USD/CAD Daily Price Chart
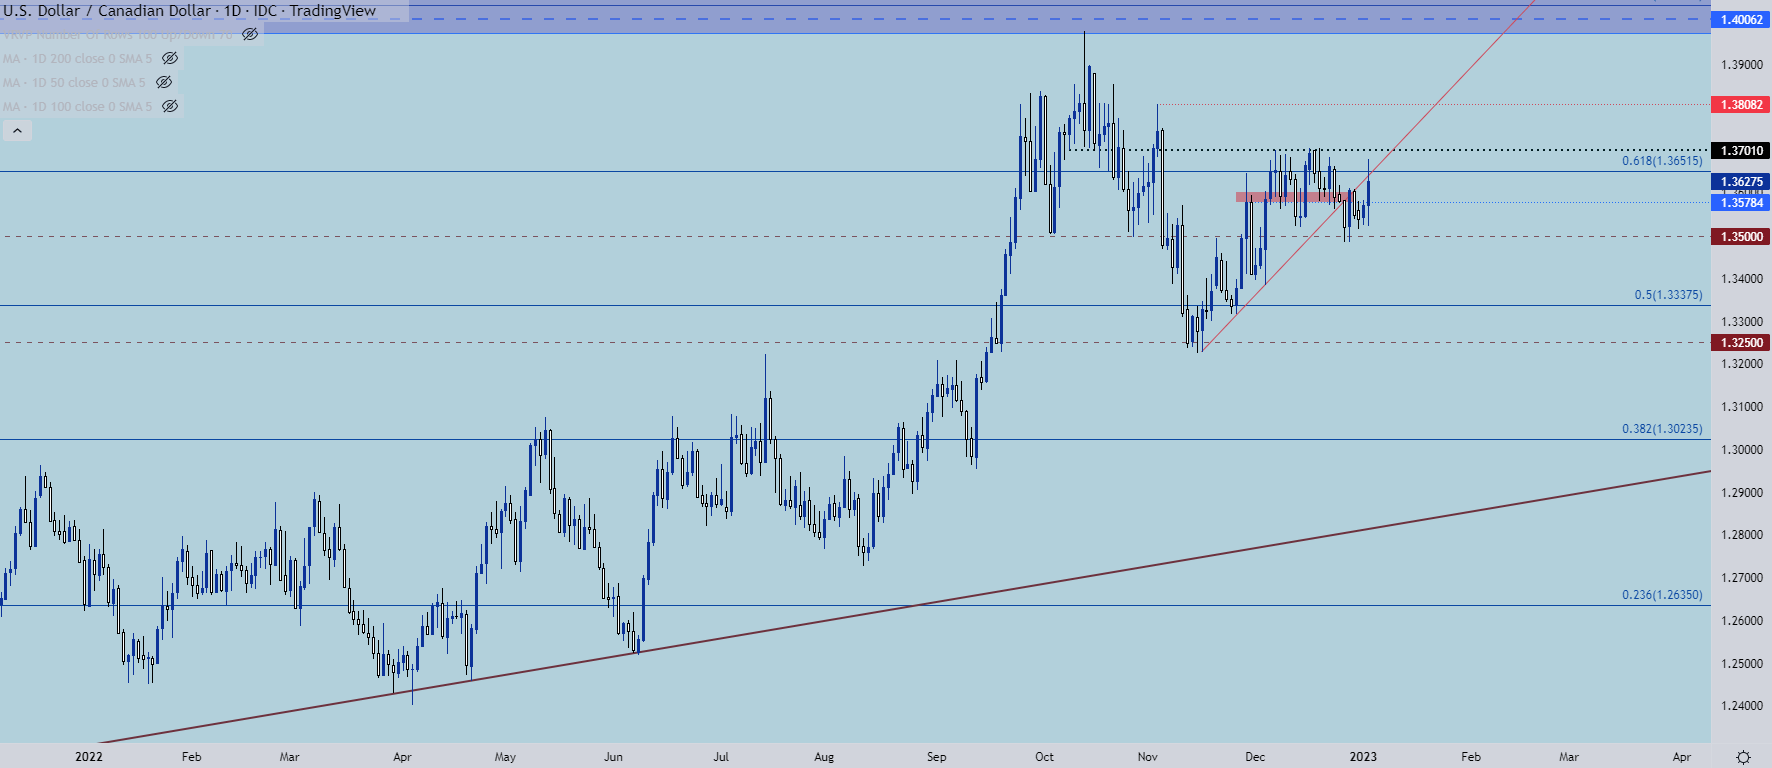
Chart prepared by James Stanley; USDCAD on Tradingview
USD/JPY Testing the Turn of the Trend
USD/JPY had a hyperbolic second-half of last year. The currency jumped by as much as 2,000 pips. And then in the back half of 2H it gave back 2,000 pips. At the forefront of the drive is Japanese Monetary policy which technically hasn’t changed or shifted yet. But, the writing does seem to be on the wall as inflation has continued to climb in Japan and at this point, the BoJ is the extreme outlier in regards to policy, which is what had initially led to that 2,000 pip peak-to-trough ramp in Q3 last year.
But for much of the run the question remained, for how long can the BoJ be such an extreme outlier by keeping policy loose and passive as the rest of the world lifts rates?
With BoJ Governor Kuroda’s term set to conclude in April, there’s already building expectations that some change will be afoot. To what degree we will have to wait and see, but there were stacking indications late last year that the bank may be preparing for such, when they announced that they were doing a policy review.
This can make the prospect of Yen-weakness a more daunting theme this year. While the carry is still tilted towards JPY-weakness, if the prospect of principal losses outweighs the possible benefit of the carry, well the trend can still stay in reverse. I’m looking to Yen-strength as one of my Top Trades for this year, but not against the US Dollar; I’ve chosen GBP/JPY instead.
In USD/JPY, a major support level is already in-play at the 130.00 handle. This could be a difficult spot to look to establish bearish exposure.

USD/JPY Weekly Chart
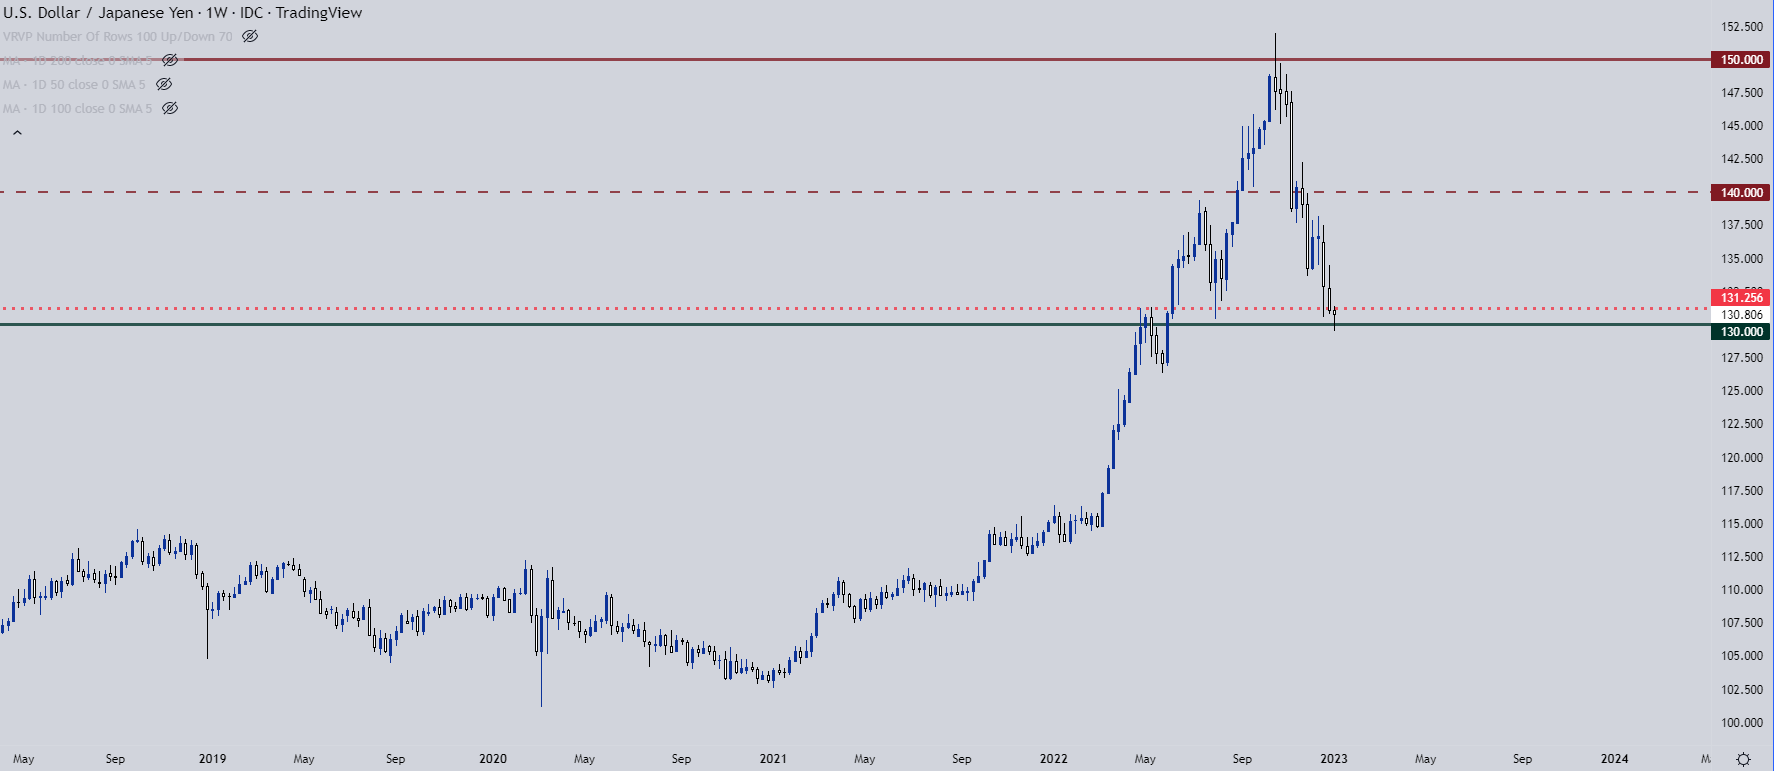
Chart prepared by James Stanley; USDJPY on Tradingview
USD/JPY Shorter-Term
From the daily chart below, we can locate a couple of spots of interest for USD/JPY bears. The first is already in-play, as prior support from the 131.25 level. A little higher is another important price action spot, however, at 134.45. This was a swing-low-turned-resistance and if price can force its way up there for a re-test, a hold keeps the door open for bearish swings.
USD/JPY Four-Hour Price Chart
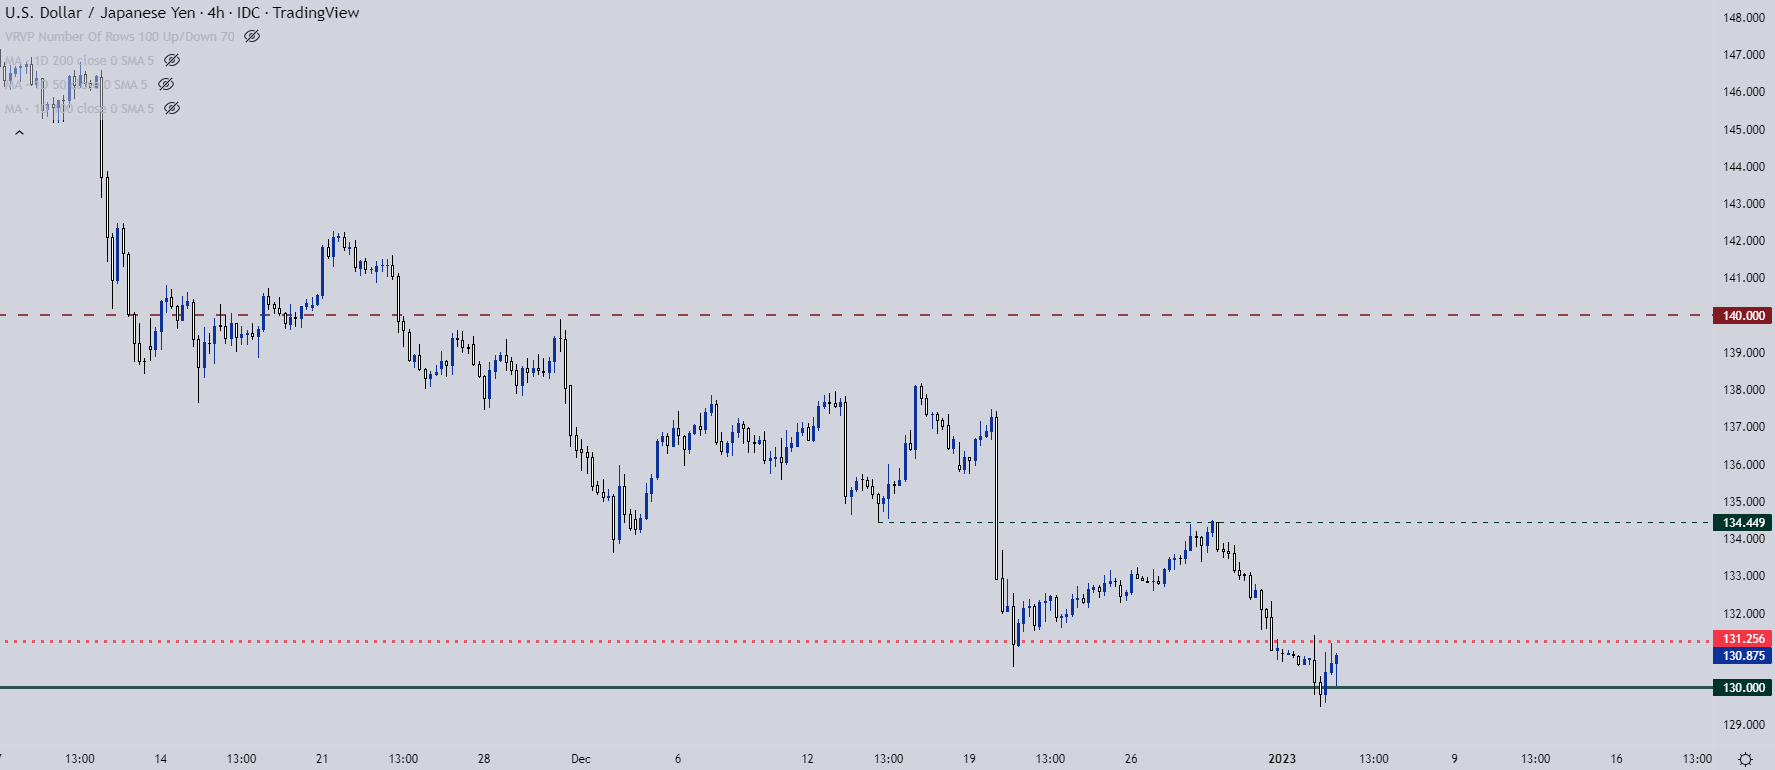
Chart prepared by James Stanley; USDJPY on Tradingview
--- Written by James Stanley
Contact and follow James on Twitter: @JStanleyFX


