
S&P 500 TECHNICAL OUTLOOK:
- U.S. stocks rally as market sentiment continues to improve
- The S&P 500 jumps 1.42% and comes within striking distance of clearing a key technical resistance
- All eyes on the February PCE report due out Friday

Most Read: S&P 500 and Nasdaq 100 Gain Ground Amid Improved Market Outlook
The S&P 500 rallied on Wednesday after a subdued performance on Tuesday, bolstered by risk-on sentiment as market worries about stress in the U.S. banking sector continued to ease in response to decisive measures by U.S. authorities and the Fed to shore up the financial system and restore confidence. When it was all said and done, the most important equity benchmark in the world climbed 1.42% to 4,028, with the real state and tech sectors leading the charge higher and healthcare names underperforming.
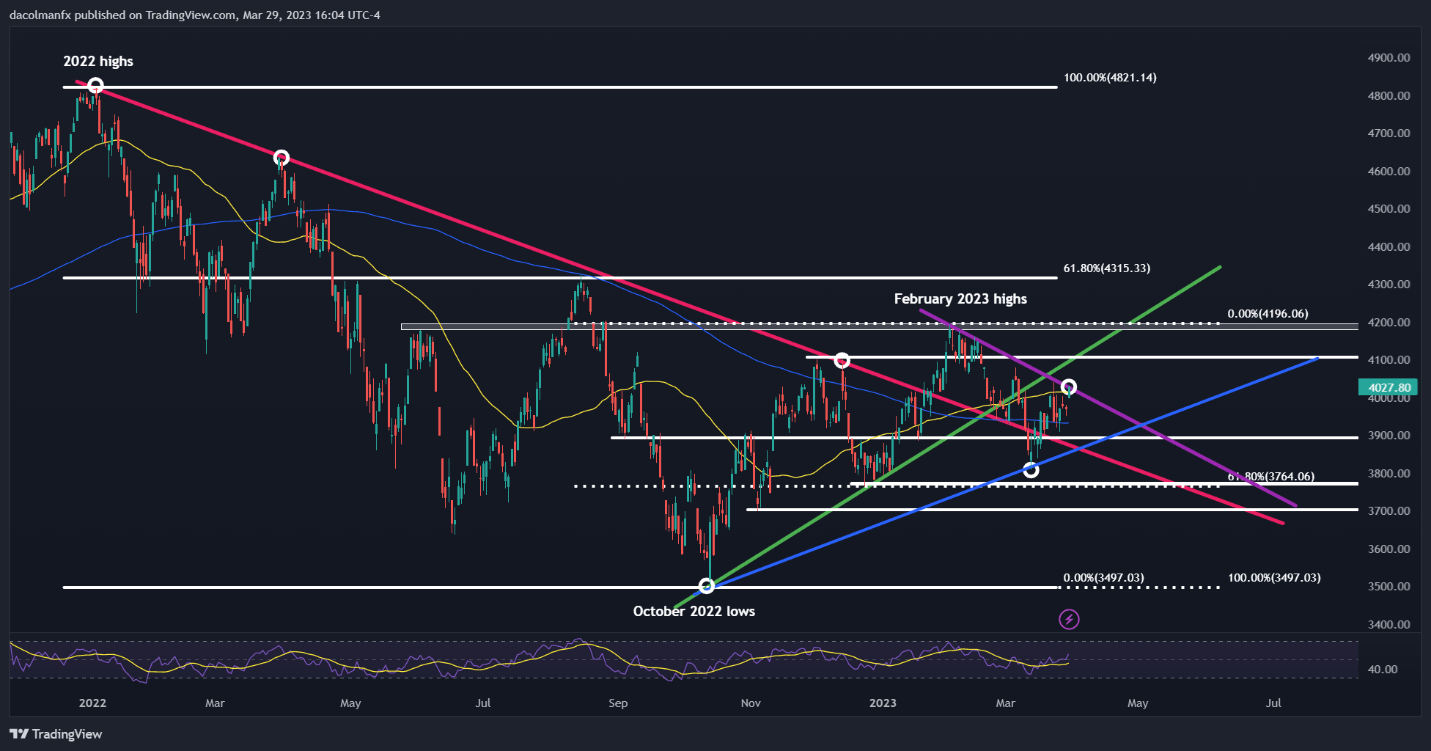
Following today’s advance, the S&P 500 has come within striking distance of overtaking a short-term descending trendline at 4,030, a key resistance worth keeping an eye on. Price reaction in this area could offer important technical clues about the near-term outlook, with a bearish rejection setting the stage for a retest of the 200-day simple moving average and a topside breakout exposing the psychological 4,100 level.
Focusing on possible fundamental catalysts, the U.S. economic calendar is devoid of high-impact events on Thursday, but Friday brings major data that could fuel wild swings across markets: the personal consumption expenditures report corresponding to the previous month. With inflation top of mind in the wake of recent red-hot numbers, the PCE price index, especially the core gauge, will take on added importance this time.
In terms of expectations, February’s core PCE is seen clocking in at 0.4% m-o-m, after a 0.6% rise at the outset of the year. With this result, the annual rate is expected to stay unchanged at 4.7%, signaling little directional improvement in the underlying trend. While this scenario has been discounted and may not trigger significant volatility, an upside surprise could spook investors, leading them to raise bets of a 25bp FOMC hike at the May meeting. This could drag the S&P 500 lower.
| Change in | Longs | Shorts | OI |
| Daily | -12% | 8% | -2% |
| Weekly | -8% | 4% | -2% |
S&P 500 TECHNICAL CHART