


Dow Jones, S&P 500 – Asia Pacific Market Open:
- Nasdaq/Dow ratio sinks the most since SVB’s collapse
- Cooling bank volatility firms 25bps Fed rate hike bets
- Dow and the S&P 500 reinforced key support levels

Asia-Pacific Market Briefing – Market Volatility Calms
The Dow Jones gained 1.2% on Monday while the S&P 500 rose +0.89% and the Nasdaq was up +0.39%. In fact, it was the best day for the blue-chip-oriented Dow versus the tech-heavy Nasdaq since Silicon Valley Bank collapsed on March 8th. In a sign of cooling volatility, the VIX market “fear gauge” declined 5.25% after at one point rising as much as 13.5%.
A closer look at the CME FedWatch Tool shows that markets continued pricing out odds of a tightening pause from the Federal Reserve this week. Now, the gauge shows about a 75% probability of a 25-basis point rate hike. According to Bloomberg, central banks around the world did not witness a dash for dollars following a joint effort with the Fed to ease access to supplies of the US Dollar.
That seems to be an encouraging sign ahead of the hotly anticipated interest rate decision and press conference from Chair Jerome Powell. Key economic event risk is notably lacking during Tuesday’s Asia-Pacific trading session, opening the door for traders to continue enjoying the volatility cooldown. That may allow for near-term strength in indices and the sentiment-linked Australian Dollar.
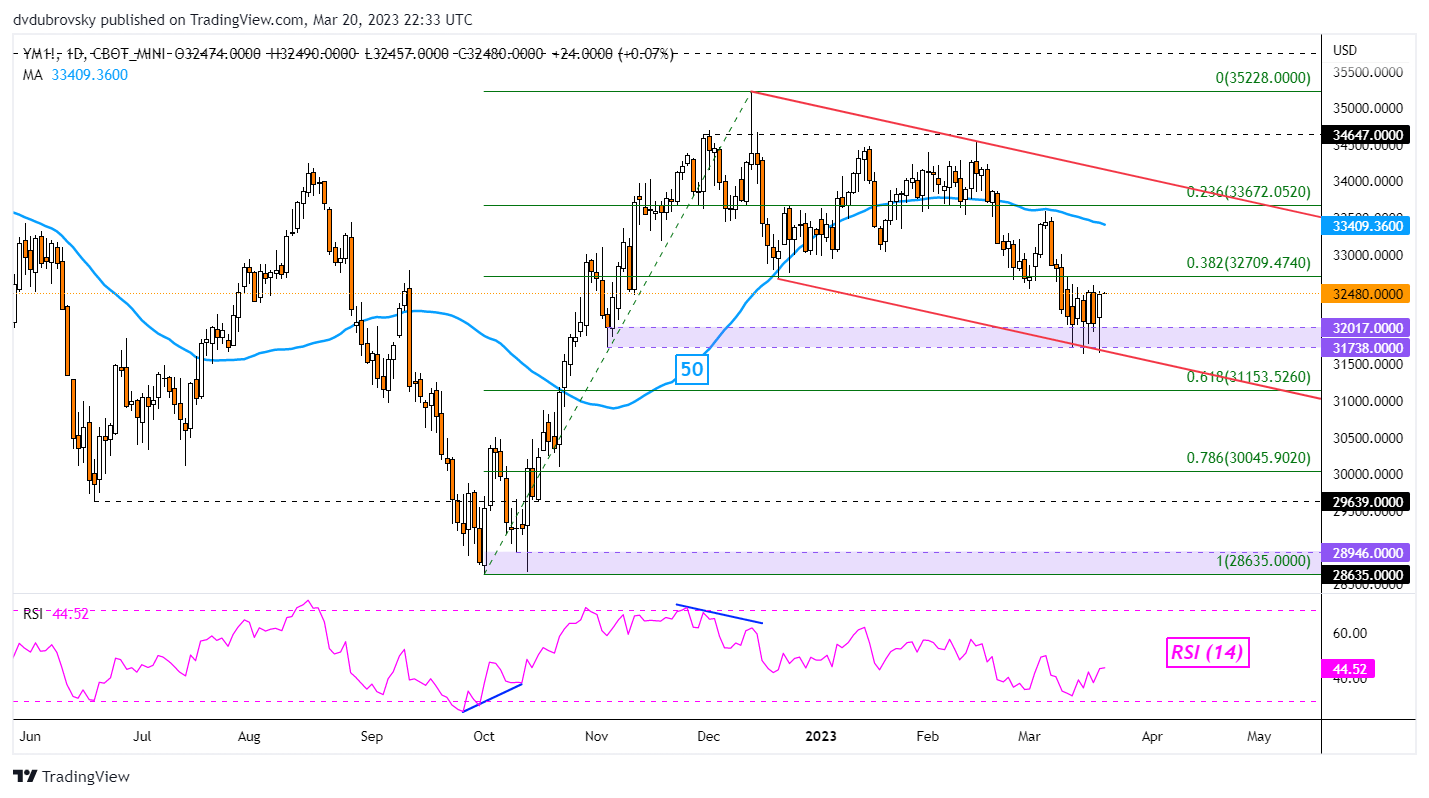
Dow Jones Technical Analysis
On the daily chart, the Dow Jones was once again unable to pierce through the critical 32017 – 31738 support zone, further reinforcing it. This is as the floor of a falling channel also held. Immediate resistance is the 38.2% Fibonacci retracement level at 32709.
Trade Smarter - Sign up for the DailyFX Newsletter
Receive timely and compelling market commentary from the DailyFX team
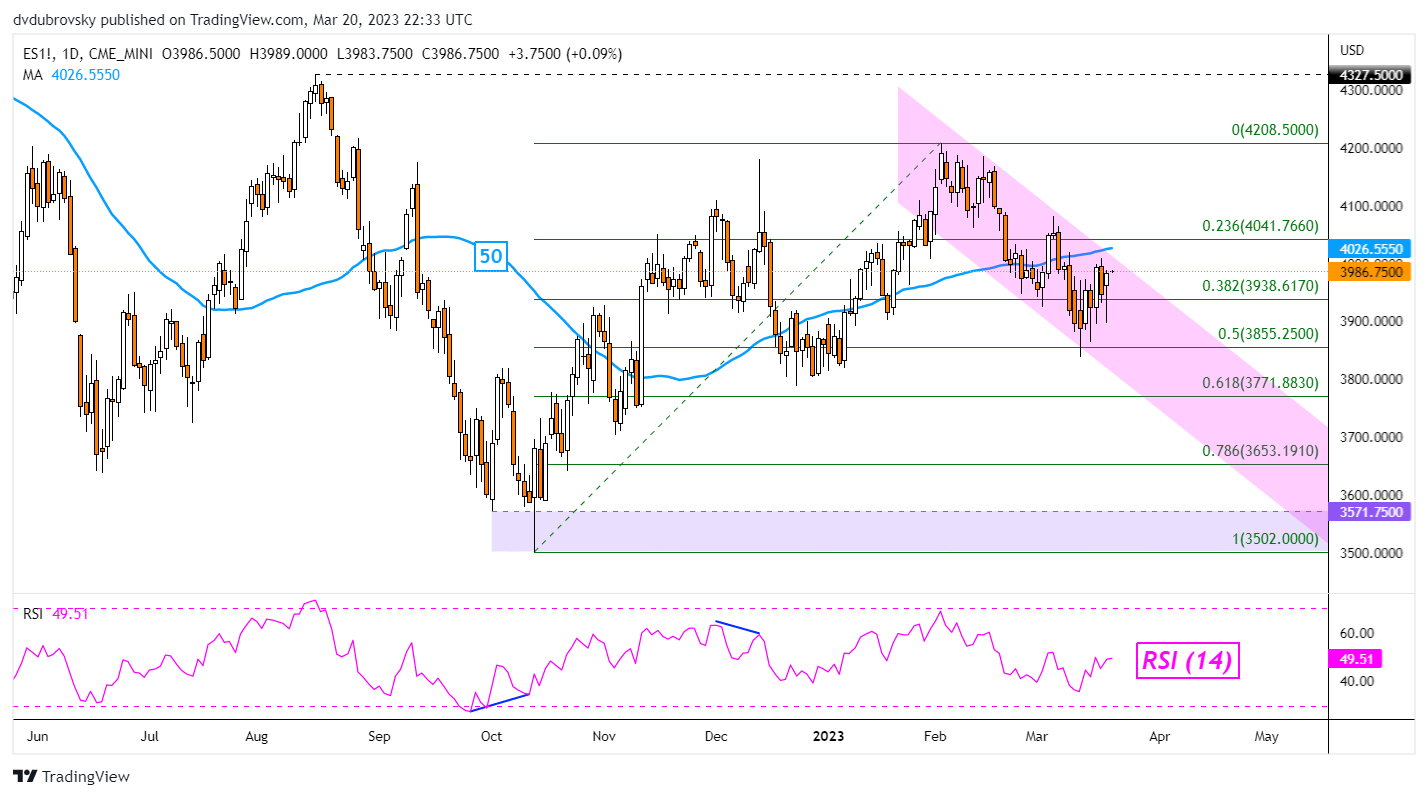
S&P 500 Technical Analysis
The S&P 500 was unable to hold a drop through the 38.2% Fibonacci retracement level at 3938, which seems to be immediate support. For the time being, the index is trading within the boundaries of a near-term falling channel. Immediate resistance is the ceiling on the daily chart below.
--- Written by Daniel Dubrovsky, Senior Strategist for DailyFX.com
To contact Daniel, follow him on Twitter:@ddubrovskyFX


