


S&P 500, SPX, NASDAQ 100, NDX - TECHNICAL OUTLOOK:
- The S&P 500 index is holding above key support but is still looking for bullish momentum.
- The Nasdaq 100 index looks relatively weaker.
- What lies ahead and what are the key levels to watch?

S&P 500 INDEX TECHNICAL OUTLOOK – NEUTRAL
The S&P 500 index continues to be weighed by stiff resistance on the 200-day moving average – it has made three unsuccessful attempts since November to clear the long-term moving average. On the weekly chart, the two rallies in the second half of 2022 we associated with subdued momentum, suggesting the index may not yet be ripe for a break higher. A break above the 200-day moving average barrier would be significant as it would be the first such break since the downtrend began a year ago.
S&P 500 Daily Chart

Chart Created Using TradingView
On the other hand, the hold in recent weeks above vital Ichimoku cloud support on the daily chart raises a small chance that the index could be attempting to form a base. In this regard, it is important for the index to hold above the December low of 3765. A failure to do so would accentuate downside risks.
S&P 500 Weekly Chart

Chart Created Using TradingView
From a slightly zoomed-out perspective, it is unclear if the December leg lower wasthe secondary low that the Q1-23 outlook highlighted. A break above the December high of 4100, around the 200-day moving average, would raise the odds that the secondary low was in place, opening the way toward the August high of 4325.
NASDAQ 100 INDEX TECHNICAL OUTLOOK – NEUTRAL
The Nasdaq 100 index appears to be the weaker of the two indices as it languishes around the 2022 lows – the underperformance possibility was highlighted in the Q1-23 outlook.
Not only is the Nasdaq 100 index well below its 200-day moving average, but it has also been under the Ichimoku cloud, in contrast to the S&P 500 index. The technology-heavy index toward the end of the year fell back to its 2022 lows, keeping alive the chances of a secondary low –see two scenarios of the formation of a secondary low pointed out in the outlook.
NASDAQ 100 Daily Chart
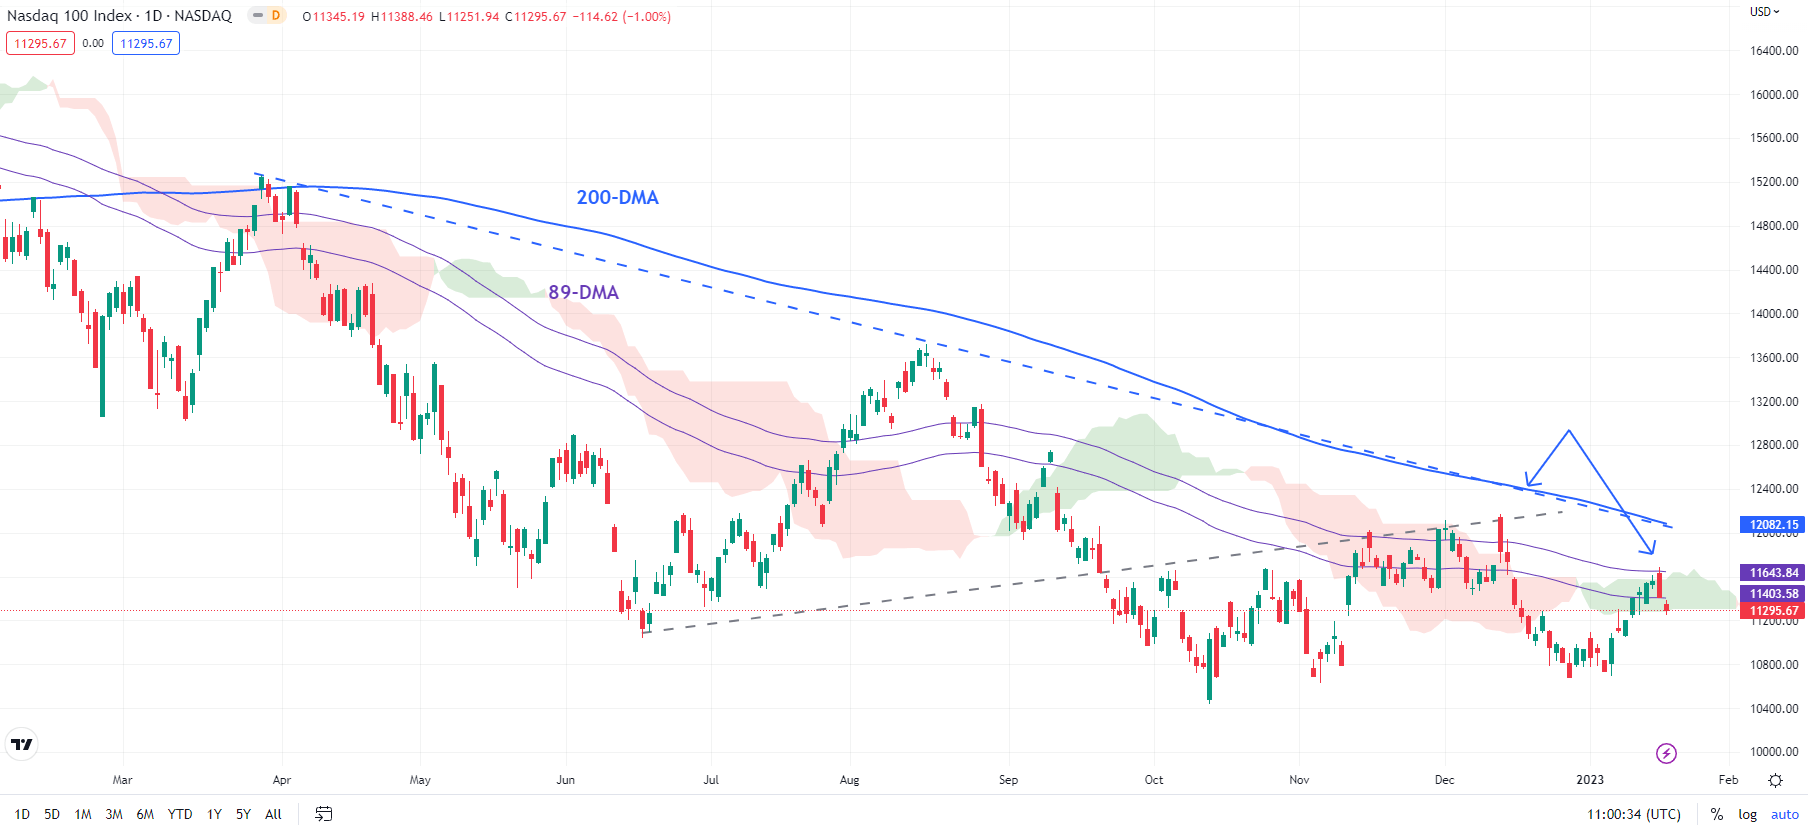
Chart Created Using TradingView
Furthermore, the index continues to struggle around the 200-week moving average and upward momentum has been feeble recently – similar to the corrective rallies in the latter part of 2022. The December high of 297, coinciding with the 200-day moving average, remains a vital ceiling. Any break above could open the way toward the August high of 334, and potentially raise the odds that the secondary low was in.
NASDAQ 100 Weekly Chart
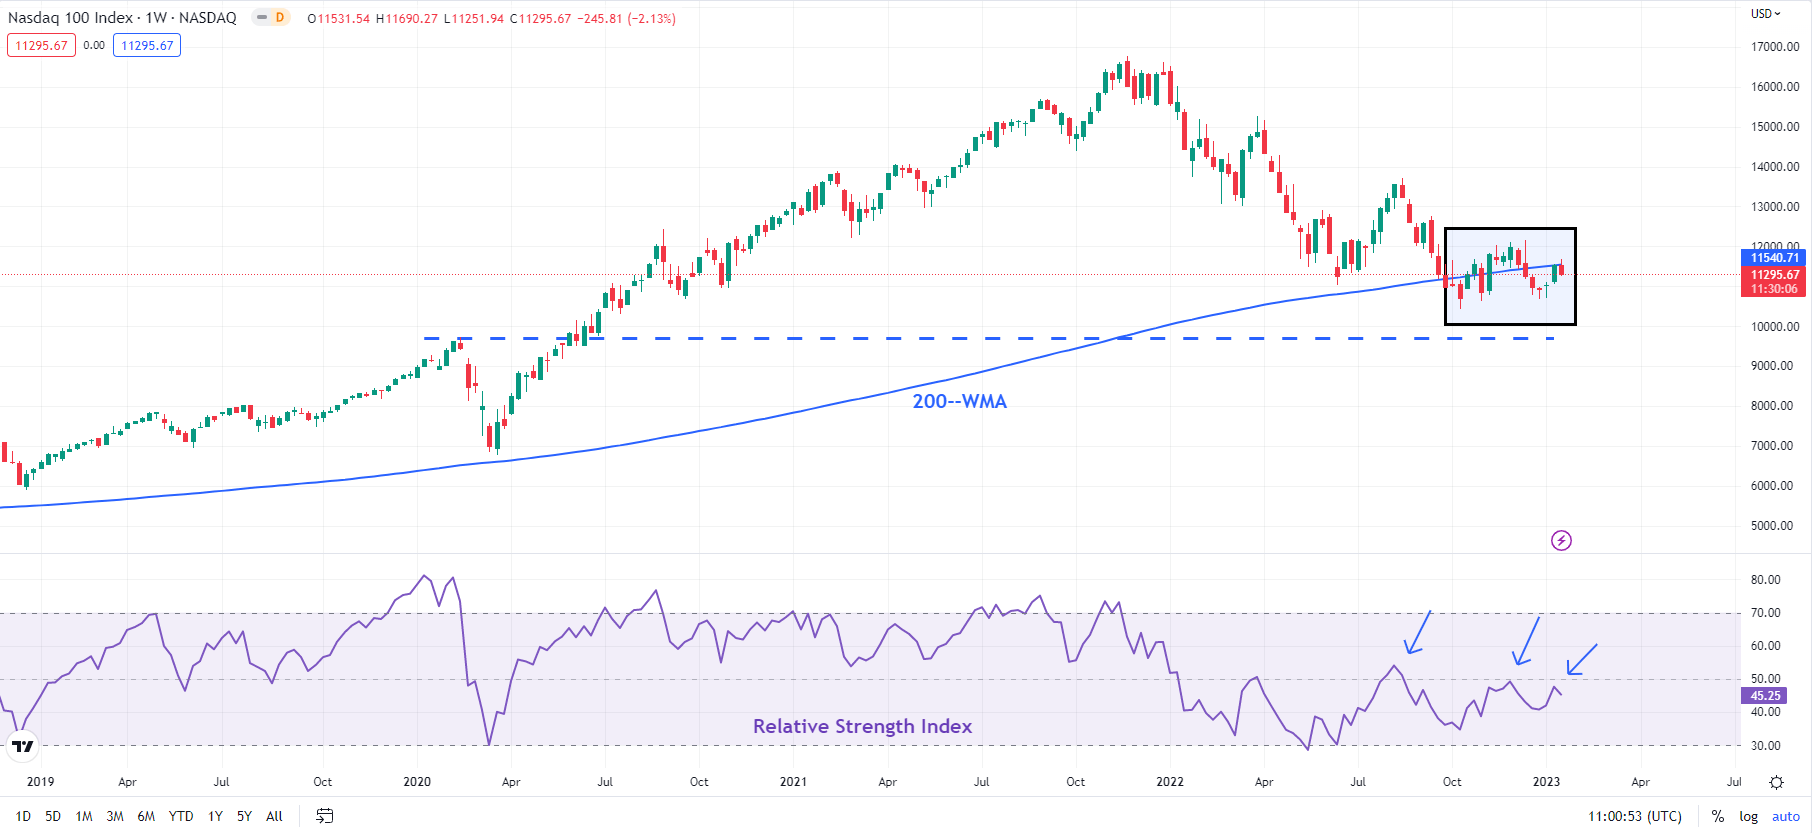
Chart Created Using TradingView
On the downside, any break of the October low of 10440 could pave the way toward the pre-Covid high of 9737 and an uptrend line from 2016, near the 89-month moving average. A more bearish scenario is a fall toward the 2018 high of 7692.

--- Written by Manish Jaradi, Strategist for DailyFX.com


