


S&P 500 and Nasdaq Composite Index Technical Outlook: Range in early 2023
Tentative signs are emerging that US equity indices could be nearing the end of their corrective decline and appear set to settle in a range in 2023.
The S&P 500 index lost 27% in the first ten months of 2022, while the Nasdaq 100 index fell 37% during the period. Both indices have held strong support around the 200-week moving average, slightly above the pre-Covid highs – a possibility that was highlighted in the previous quarterly forecast. To be fair, the previous quarterly argued that US indices could be in the advanced stages of the decline, but it is not yet unambiguously clear yet that the downtrend is over for the US equities.
That’s because, while the indices have found support and the downside risks have reduced, it is not certain if the rebound from October is a corrective rebound or the end of this year’s downtrend. This means that while the broader uptrend could resume sometime later in 2023, the path remains uncertain – whether the indices will retest the October lows (or lower), or strengthen from here on. As the previous quarter’s update pointed out the upward sloping 200-week moving average and positive Moving Average Convergence Divergence on the monthly and quarterly chart indicate that the long-term trend remains up. Let’s look at the two indices individually.
S&P 500 INDEX TECHNICAL OUTLOOK – NEUTRAL
As the monthly chart shows, the momentum is still down, though it appears to be fading (as the chart shows). The 14-week Relative Strength Index (RSI) failed to rise toward the 60-mark – readings above 60 not only signify strengthening momentum, but at times also indicate a trend reversal. In all fairness, the current rebound is similar to the one in June-August, when the RSI ran out of steam below 60. This was followed by a renewed leg lower in the index.
S&P 500 Weekly Chart
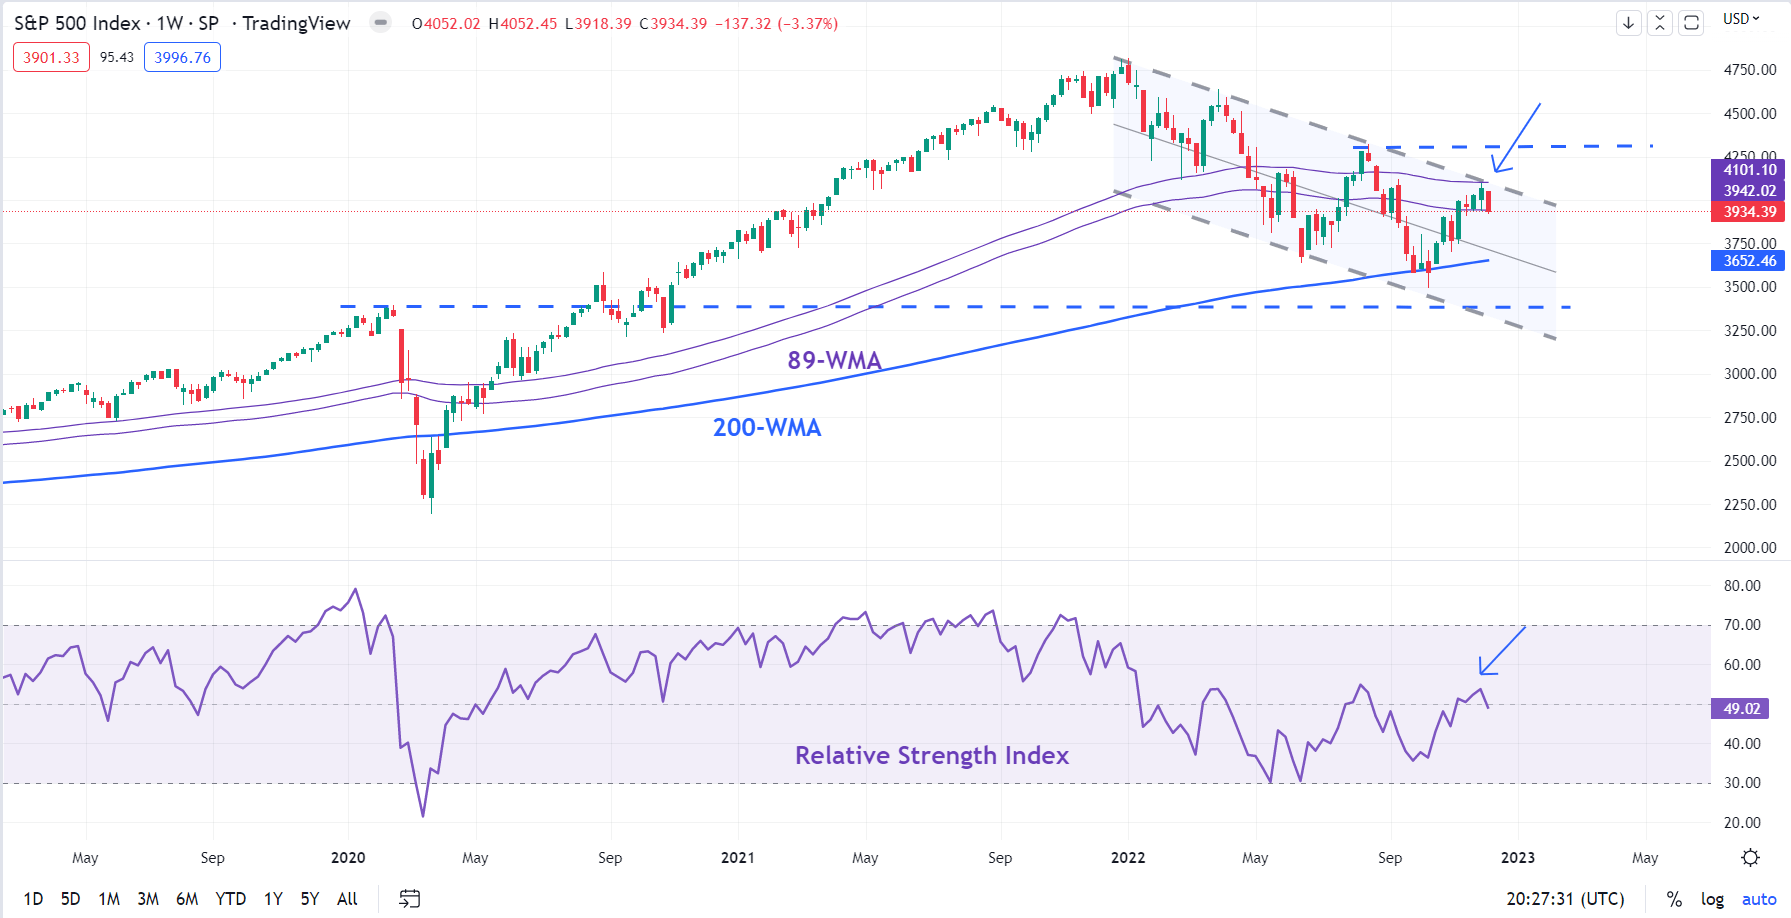
Source: TradingView
Furthermore, the index hasn’t broken any meaningful resistance. In this regard, the converged resistance: the upper edge of a downtrend line from early 2022, the 89-week moving average and the August high of 4325 is a crucial ceiling. The index needs to break above this resistance for the medium-term downside risks to fade.
S&P 500 Monthly Chart
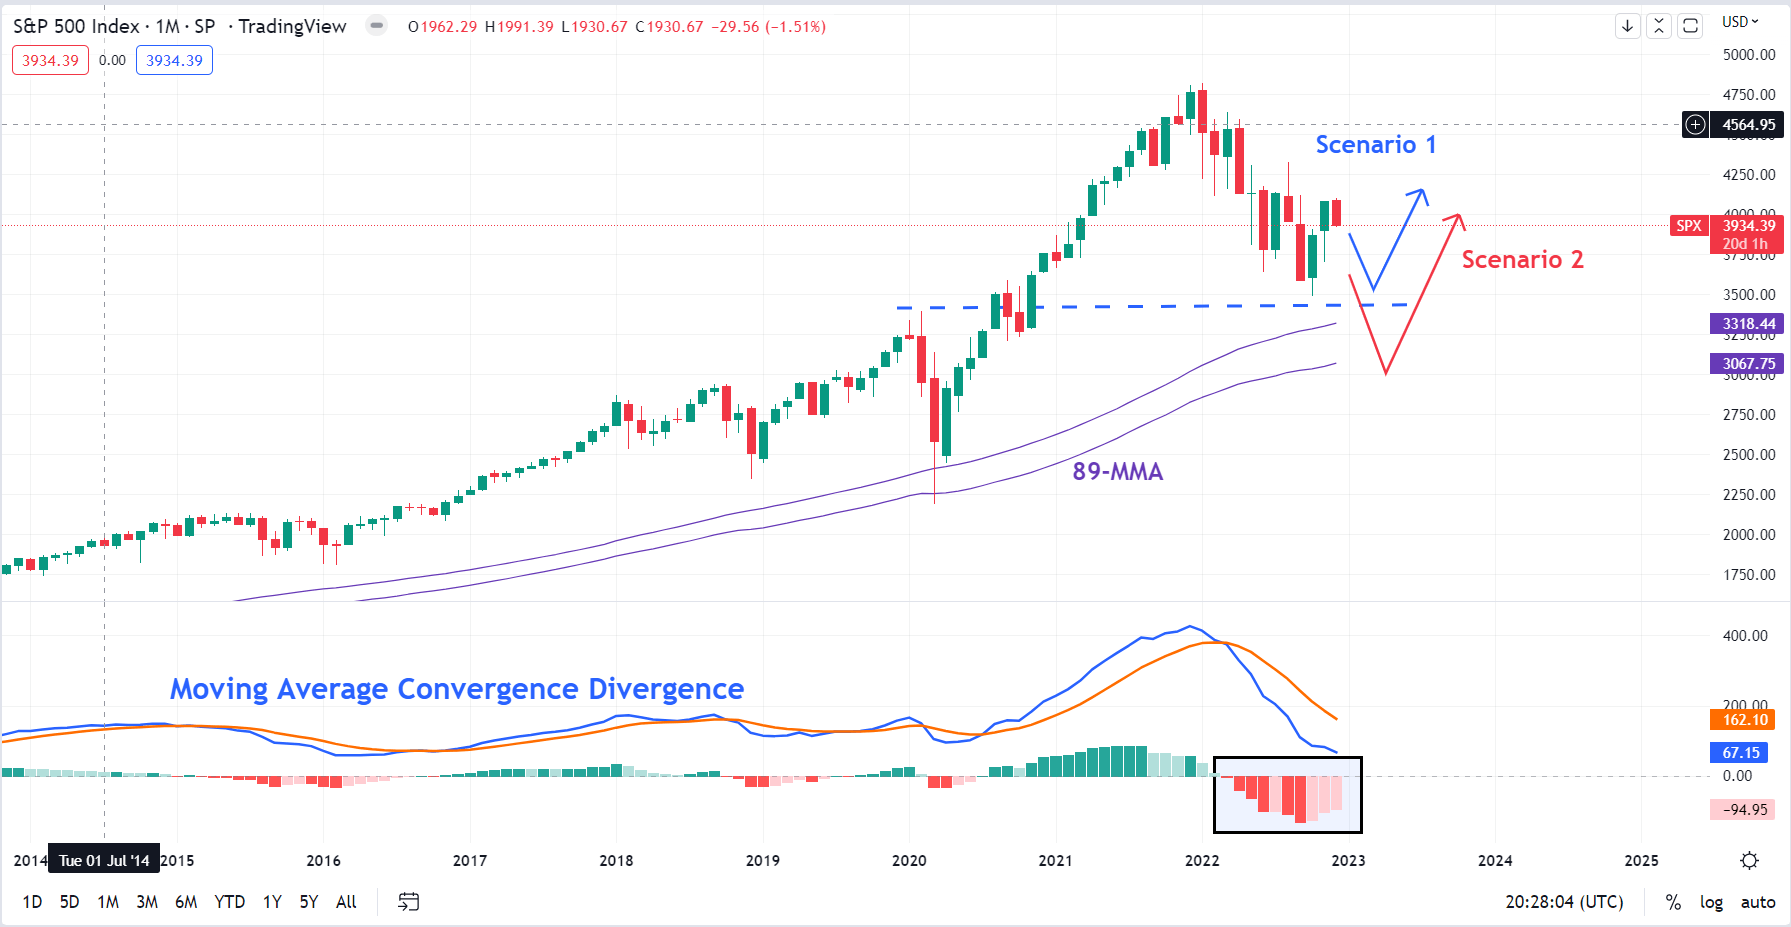
Source: TradingView
Two scenarios could unfold in early 2023. Both envisage a drop to begin with before stabilizing/rebounding. The question is how much lower. The preferred scenario for the upcoming quarter is one where the index makes a secondary/higher low relative to the October low before eventually clearing the above-mentioned resistance.
The second scenario, a relatively low probability one, is where the index drops below the October low, but supported around the 89-month moving average near the psychological 3000 mark. The subsequent rebound in this case could turn out to be shallower than scenario 1.
NASDAQ 100 INDEX TECHNICAL OUTLOOK – SLIGHTLY BEARISH
The outlook for the Nasdaq 100 index is slightly bearish relative to the S&P 500 index. Both scenarios envisage a drop below the October low.
NASDAQ 100 Index Monthly Chart
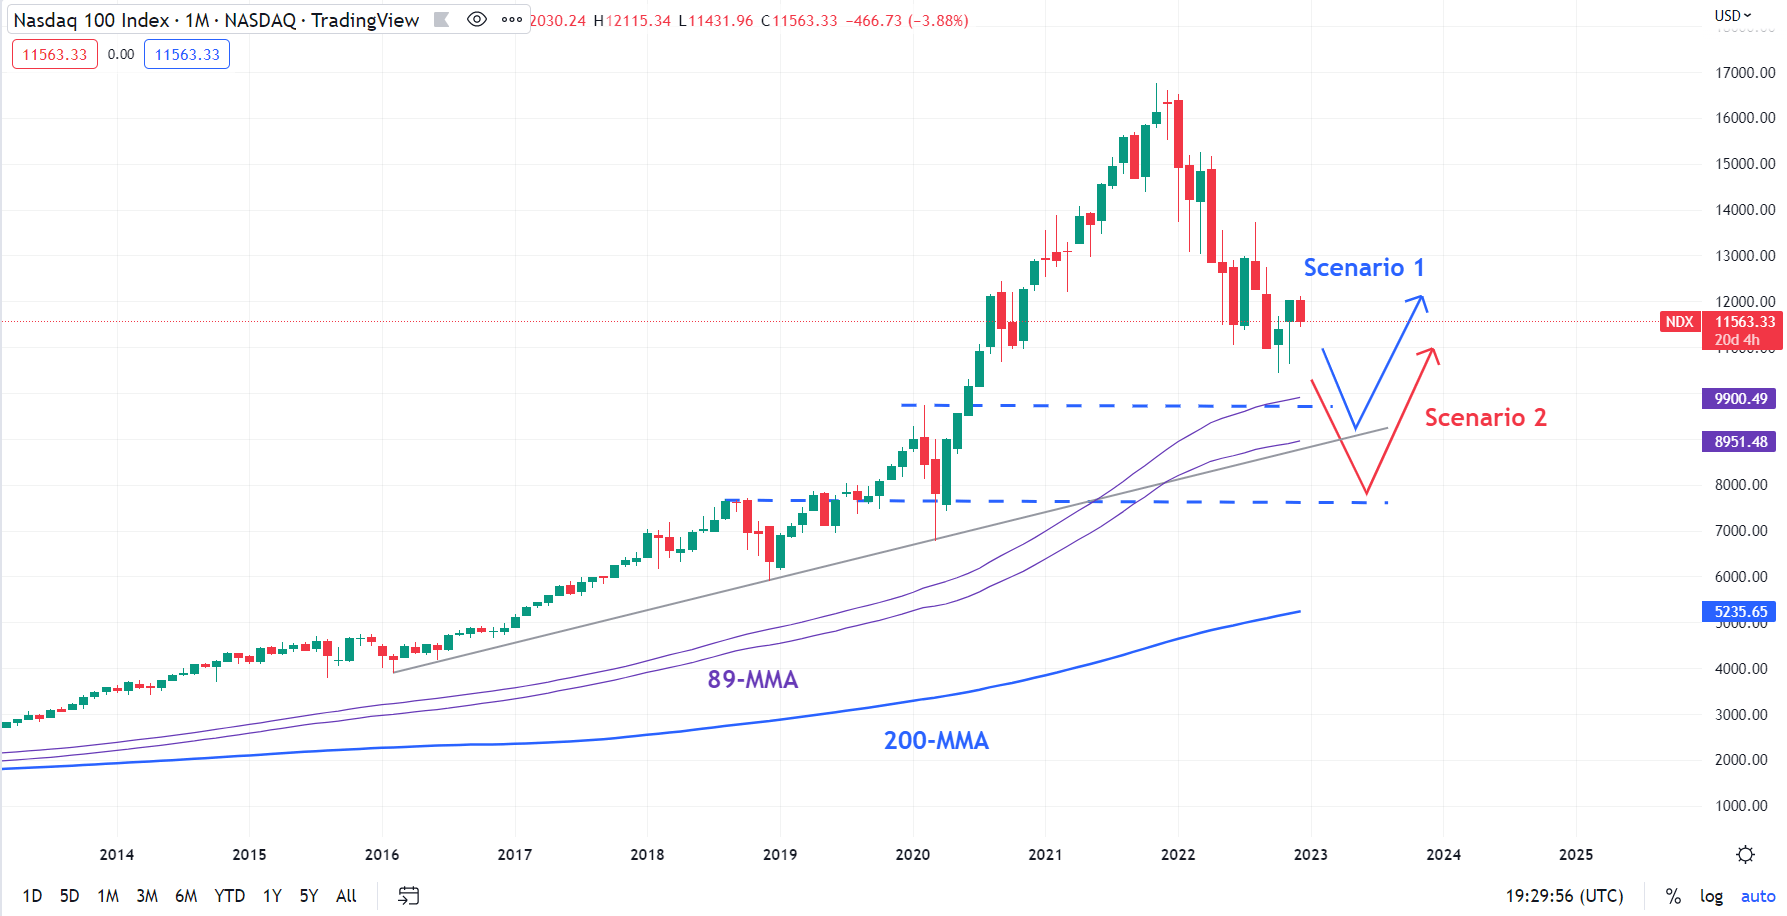
Source: TradingView
The preferred scenario is one where the index could drop below its October low toward the pre-Covid high of 9737 and an uptrend line from 2016, near the 89-month moving average, before turning around. An alternate scenario, a less preferred scenario, is the one where the index cracks the October low toward the 2018 high of 7692 before staging a rally.


