


US Dollar, Japanese Yen, USD/JPY – Outlook:
- USD/JPY’s short-term uptrend is intact as it approaches stiff resistance area.
- US Treasury yields are showing signs of fatigue.
- What is the outlook on USD/JPY?

USD/JPY TECHNICAL OUTLOOK – NEUTRAL
Developments on the technical charts suggest that the bar is rising for USD/JPY and US Treasury yields to continue their recent run.
USD/JPY and US Treasury yields rose on Friday after the US personal consumption expenditures price index, the Fed’s preferred inflation gauge, rose 0.6% on-month in January, higher than the 0.4% expected. Personal spending jumped 1.8% in January Vs the 1.3% forecast. Friday’s stronger-than-expected US data was yet another evidence after a series of upbeat data since the start of the month that suggests the economy isn't slowing enough and that the US Fed would need to hike rates further and longer in the foreseeable future. Rate futures are now pricing in the Fed funds rate to peak around 5.39% in September Vs slightly over 5.3% in July before Friday’s data.
USD/JPY Daily Chart
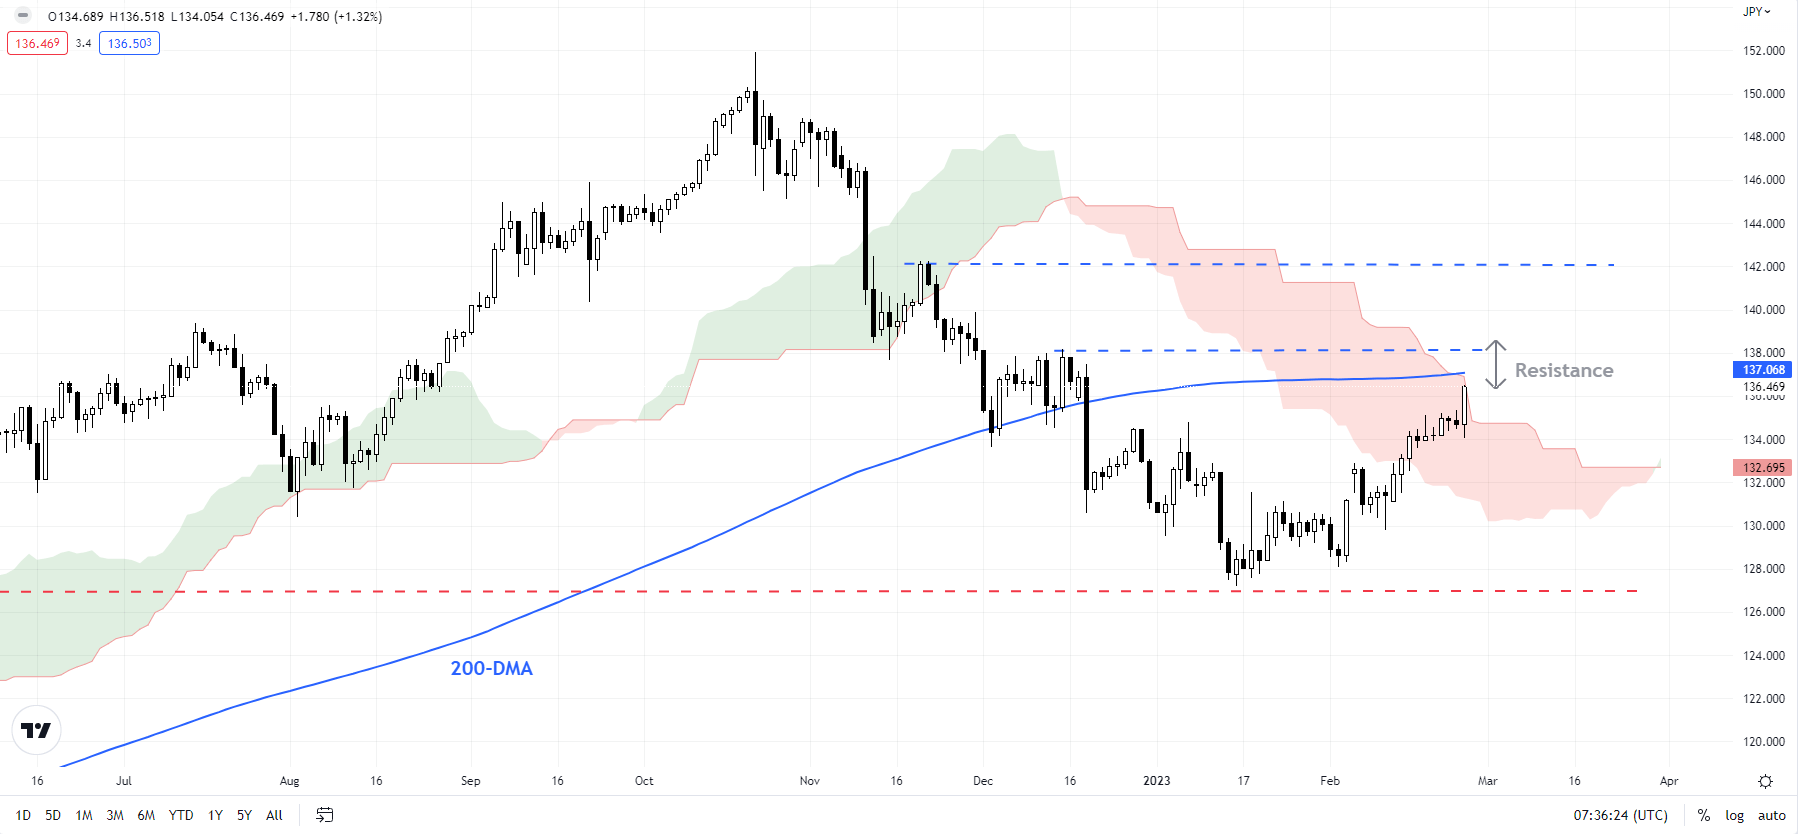
Chart Created Using TradingView
Furthermore, incoming Bank of Japan Governor Kazuo Ueda cooled speculation of an earlier end to ultra-easy monetary policy, aiding USD/JPY. Ueda's remarks on Friday left open the door for tweaking the yield curve control (YCC) in the future but said the central bank must maintain the ultra-easy policy to support the economy.
Ueda said there were side effects emerging from the policy such as deteriorating market function, adding that the BOJ needed to monitor whether the measures it took in December such as widening the band around its yield target will help ease the side effects. The YCC is widely perceived to be unsustainable given elevated inflation, globally and domestically, and the potential distortions it creates on the yield curve.
US Treasury 10-year Yield Daily Chart
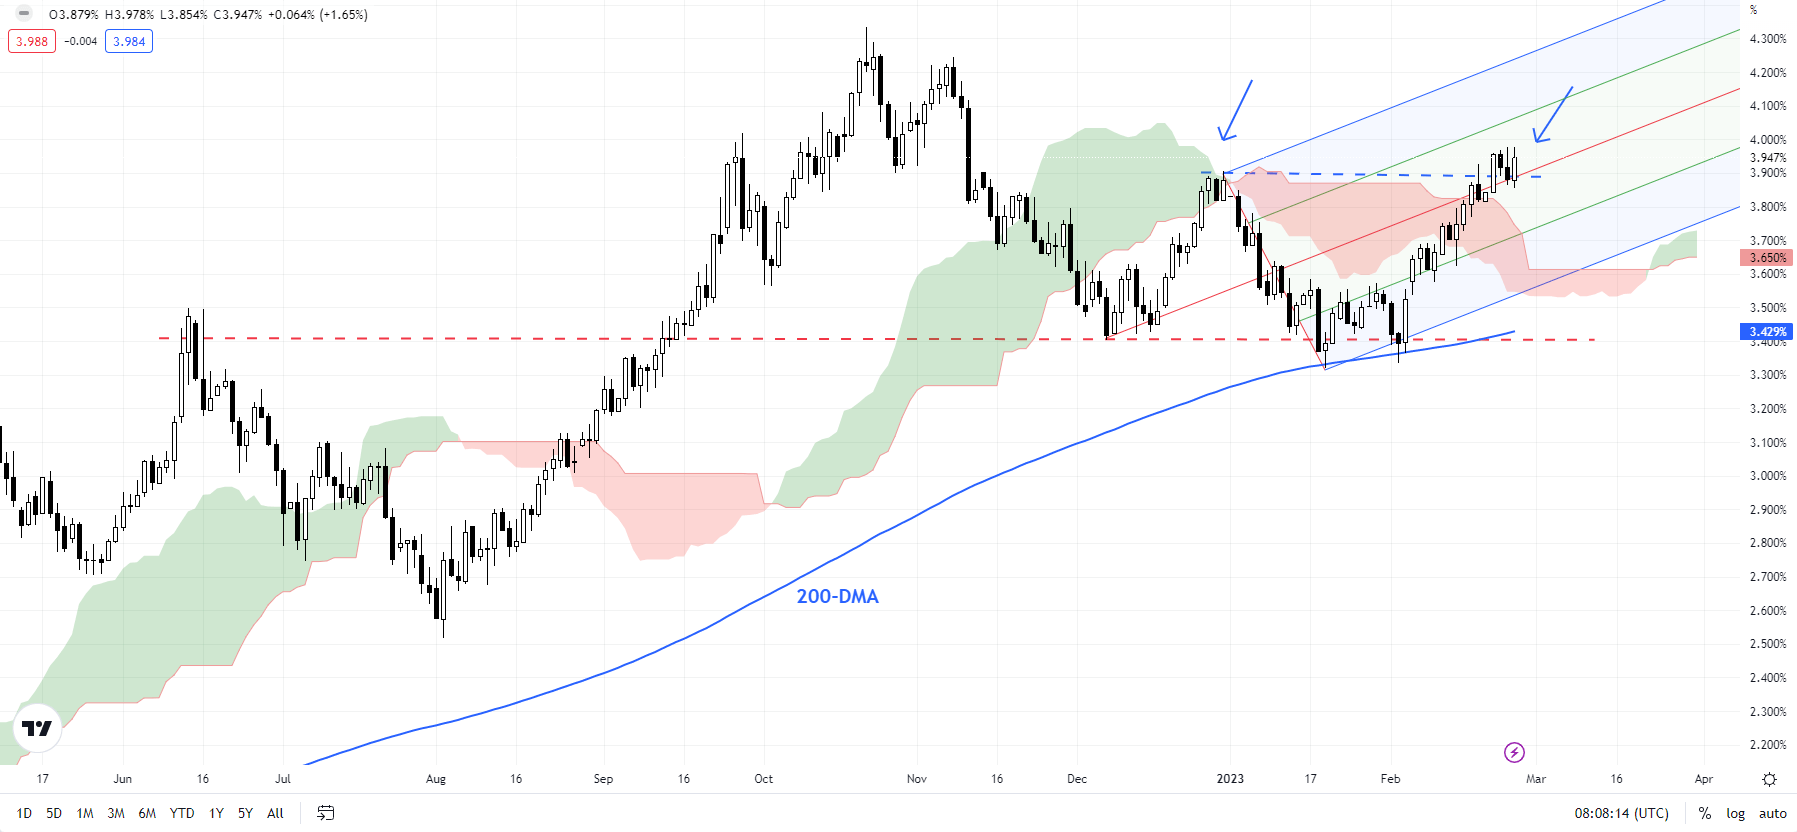
Chart Created Using TradingView
On technical charts, USD/JPY has risen above the lower end of a stiff converged resistance zone of 135.00-138.00. It is now approaching the 200-day moving average (now at about 137.10), the upper edge of the Ichimoku cloud resistance on the daily charts, and near the mid-December high of 138.20 (see the previous update “Japanese Yen Price Setup: How Much More Upside in USD/JPY?”). Subsequent resistance is at the late-November high of 142.25.
US Treasury 2-year Yield Weekly Chart
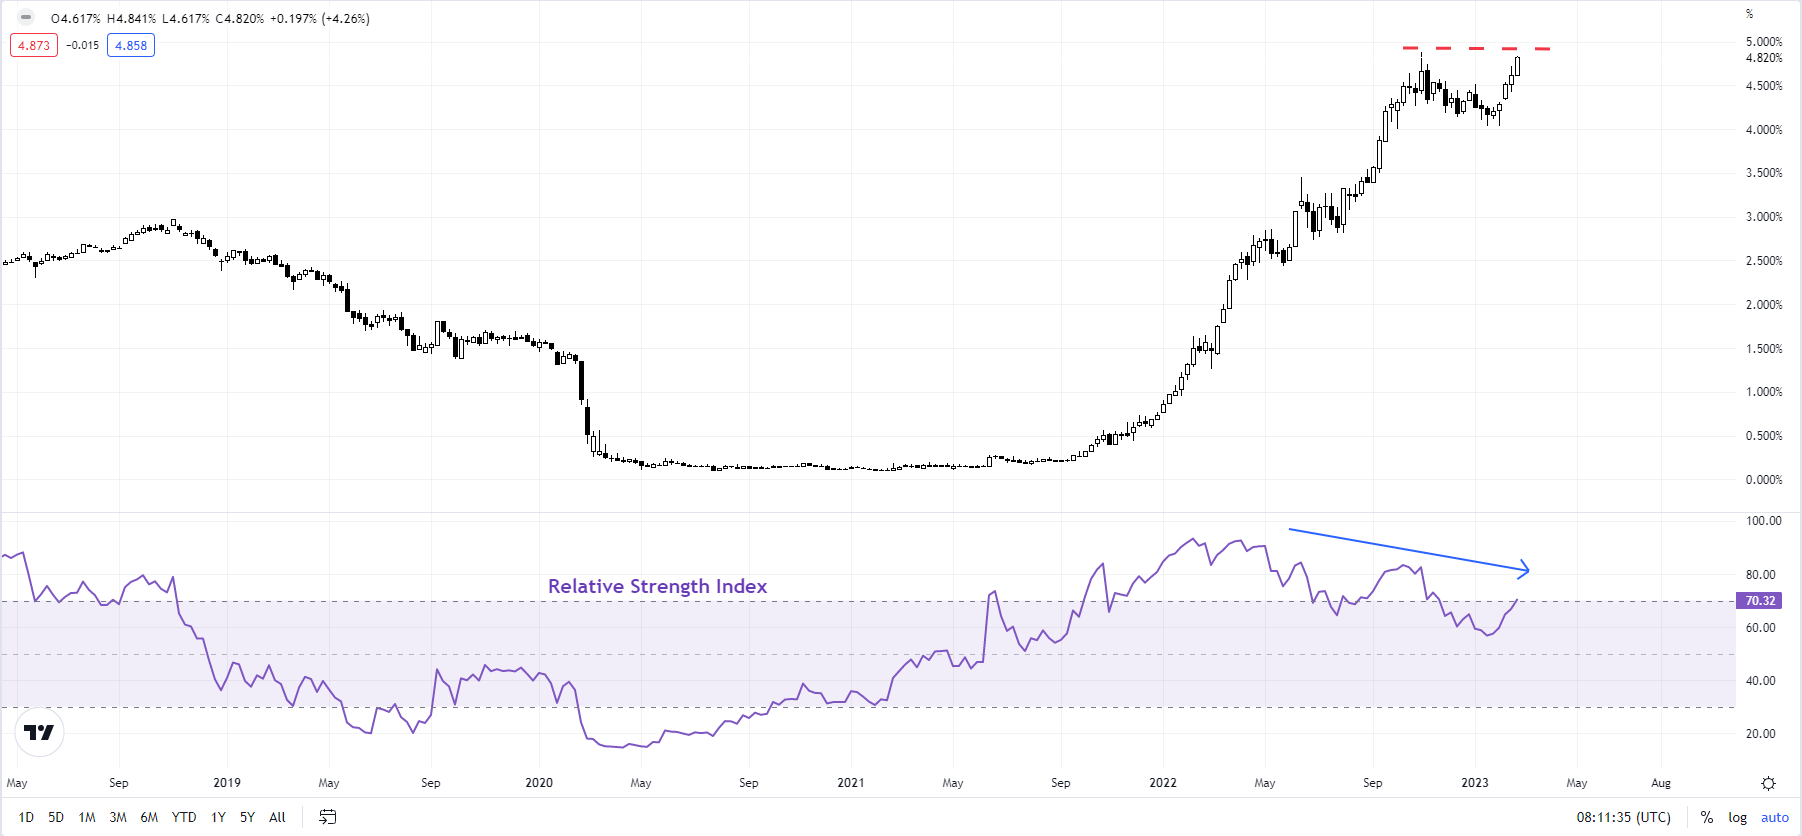
Chart Created Using TradingView
The resistance area of 135.00-138.00 could be tough for USD/JPY to crack as the rally in US Treasury yields looks tired. Despite the recent strong US data, the US Treasury 10-year yield and the US Treasury 30-year yields have been struggling at the solid barrier at their respective December highs. In addition, negative momentum divergence on the daily and weekly charts of the US Treasury 2-year yield indicates the bar is rather high for it to cross the October high of 4.88%.
USD/JPY 4-Hourly Chart
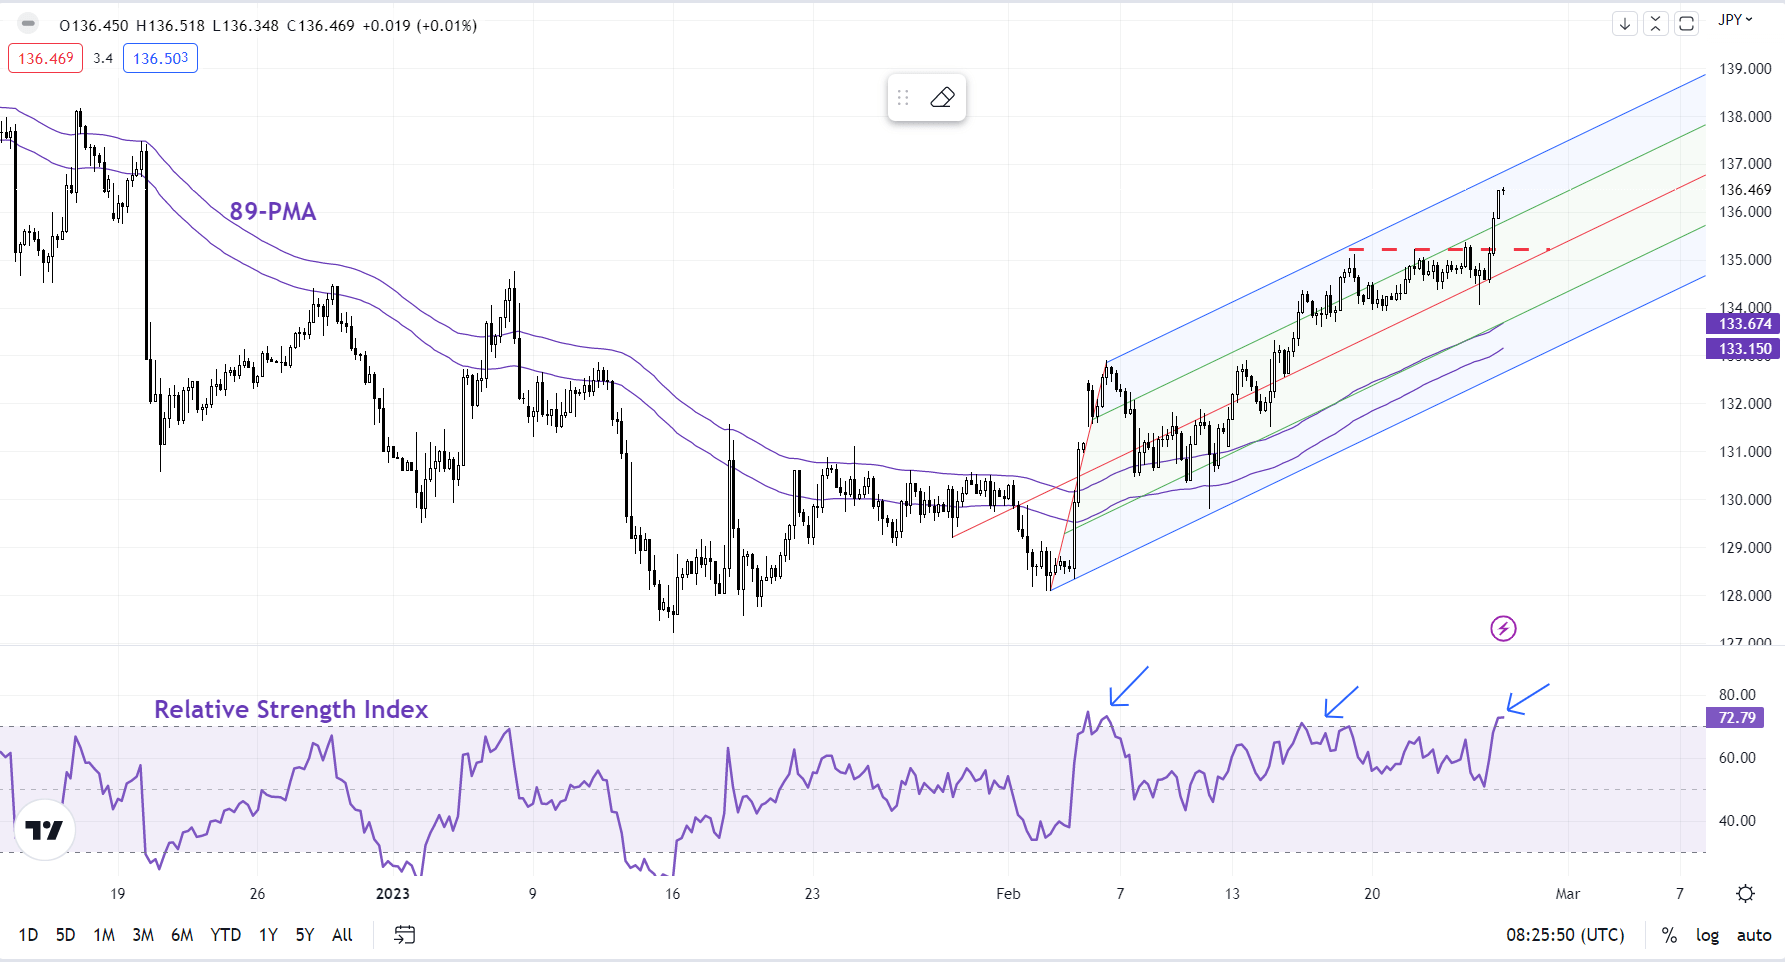
Chart Created Using TradingView
Having said that, USD/JPY continues to make new highs on intraday charts (see the 240-minute chart). At the very least, USD/JPY would need to stop making daily highs and fall below immediate support on a horizontal trendline from mid-February at about 135.00 for the immediate upward pressure to begin fading. In the absence of a support break, the path of least resistance for USD/JPY is sideways to up.
Trade Smarter - Sign up for the DailyFX Newsletter
Receive timely and compelling market commentary from the DailyFX team
--- Written by Manish Jaradi, Strategist for DailyFX.com


