Gold, XAU/USD – Price Action & Outlook:
- XAU/USD has broken above key resistance.
- The break has triggered a minor reverse head & shoulders pattern, pointing to further gains.
- What are the key levels to watch in XAU/USD?

Gold rebounded after US inflation slowed more than expected in June, reinforcing market expectations that the US Federal Reserve is nearing the end of its tightening cycle.
US CPI rose 0.2% on-month in June, the smallest gain since August 2021, compared with 0.3% expected. Core CPI moderated to 4.8% on-year Vs 5% expected and 5.3% in May. Still, rate futures are showing a 92% chance of a 25-basis point hike at the July 25-26 meeting, and a small chance of another hike before the year-end, according to the CME FedWatch tool.
However, markets are pricing in rate cuts starting in H1-2023, with nearly 5 rate cuts by the end of next year. The market’s expectations contrast with the Fed’s projected two rate hikes before the year-end and no rate cuts until 2025. Wednesday’s data has further reinforced the market’s dovish pricing. Having said that, given that inflation continues to be well above the Fed’s target and the labour market remains resilient, a rate hike at the July meeting could yet go through. Beyond that, it remains highly uncertain, both in terms of whether rate hikes happen and by how much.
XAU/USD 240-minute Chart
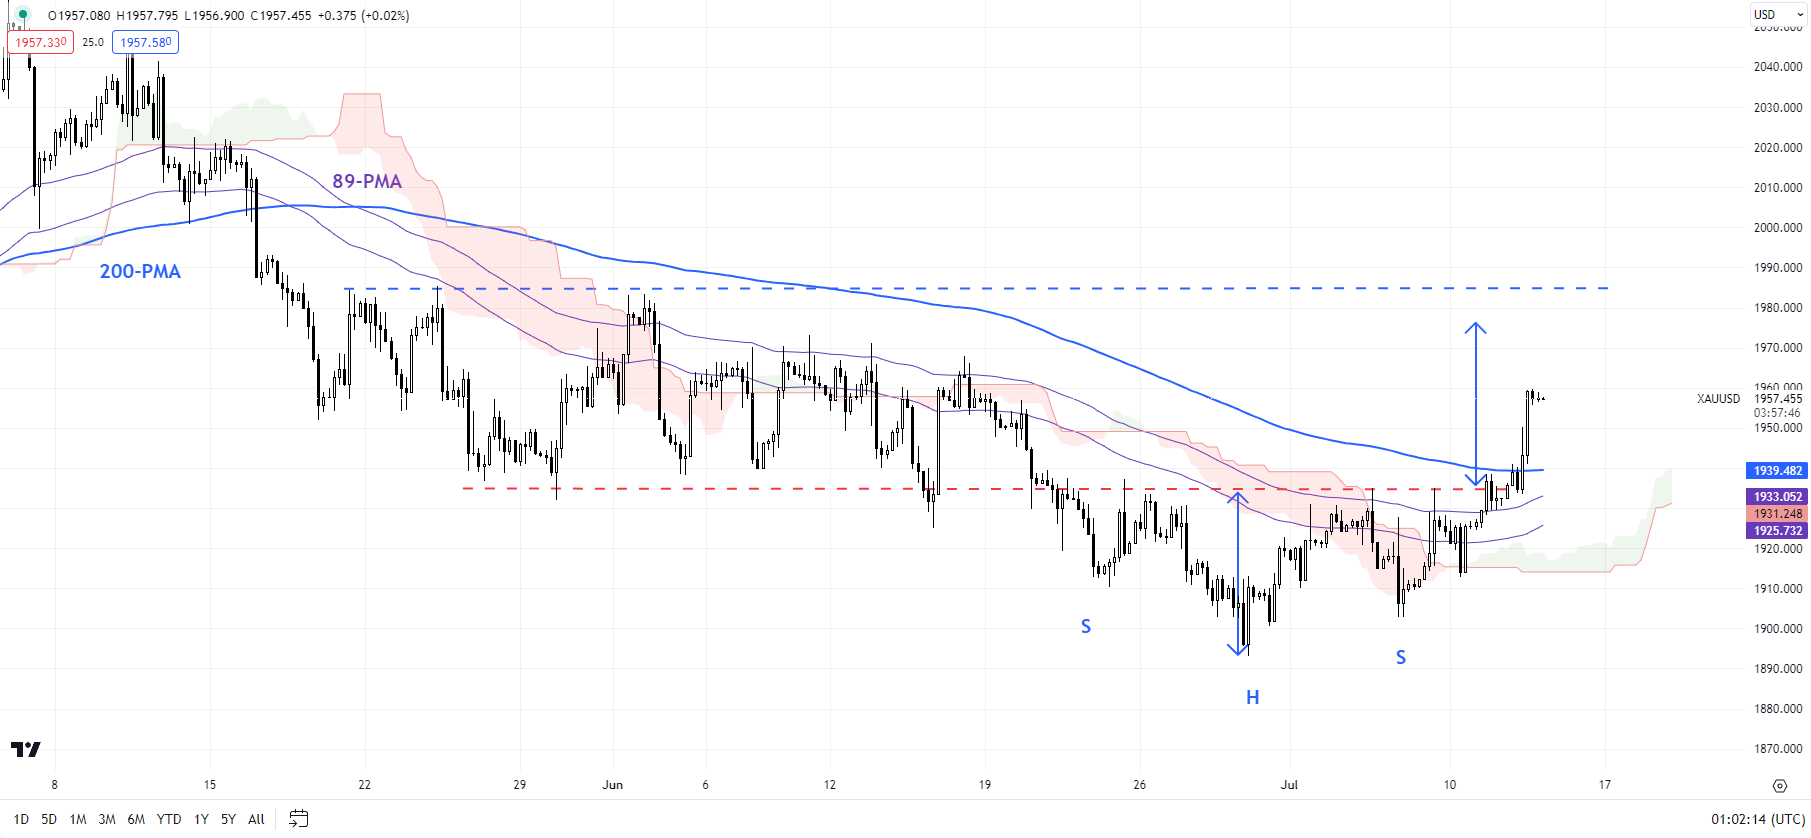
Chart Created by Manish Jaradi Using TradingView
On technical charts, the downward pressure has eased after XAU/USD rose above the key resistance area 1935-1945 (including the end-June high, the 89-period moving average, and the 200-period moving average on the 240-minute charts). The break has triggered a minor reverse head & shoulders pattern (the left shoulder is at the late-June low, the head at the end-June low, and the right shoulder is at the early-July low), with a potential price objective of around 1980, close to the early-June high of 1983.
XAU/USD Daily Chart
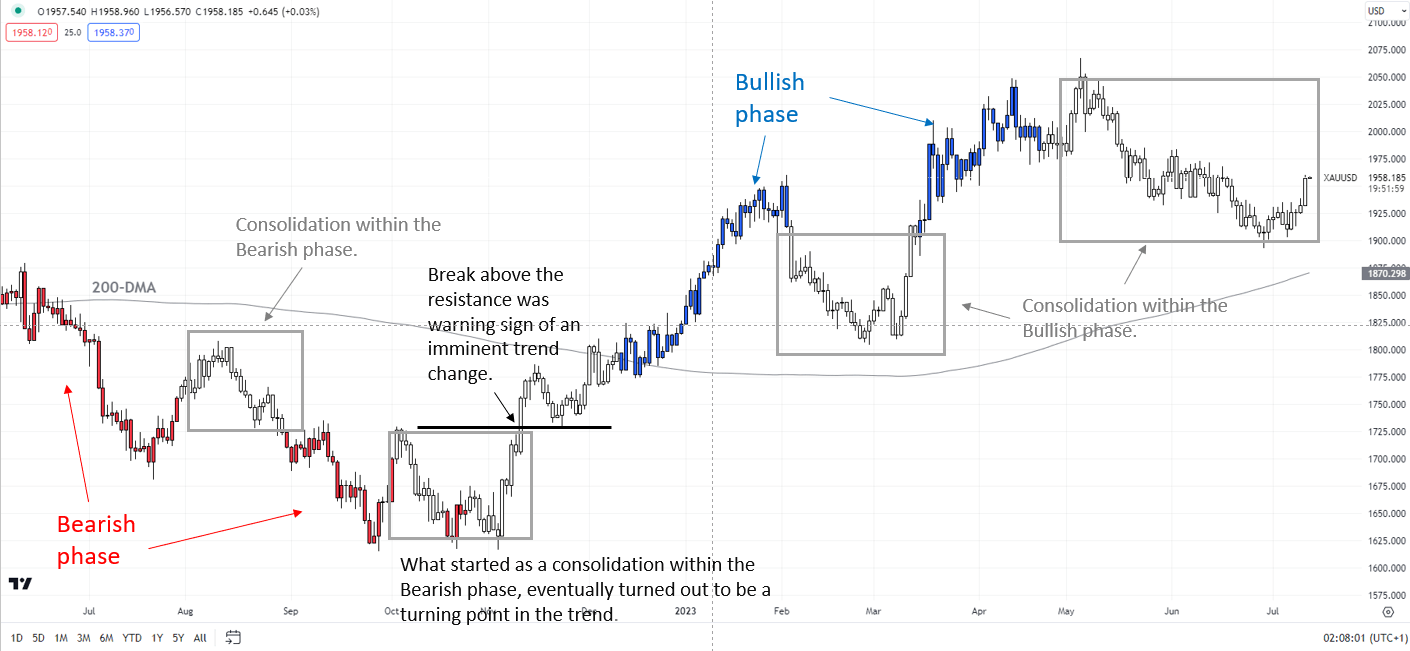
Chart Created by Manish Jaradi Using TradingView; Notes at the bottom of the page.
Intraday technical charts were showing a loss in downward momentum going into US jobs data on Friday. Moreover, XAU/USD met the price objective of a bearish triangle triggered in late June. For more discussion, see “Gold Slips After FOMC Minutes; XAU/USD Scenario Ahead of US Jobs Data”, published July 6.
Zooming out, gold remains in a consolidation phase within the broader uptrend, as the daily colour-coded candlestick charts show. However, beyond the daily charts, higher timeframe charts have shown fatigue in gold’s rally. See “Gold Could Find It Tough to Crack $2000”,published March 28, and “Gold Weekly Forecast: Is it Time to Turn Cautious on XAU/USD?” published April 16.
Note: The above colour-coded chart(s) is(are) based on trending/momentum indicators to minimize subjective biases in trend identification. It is an attempt to segregate bullish Vs bearish phases, and consolidation within a trend Vs reversal of a trend. Blue candles represent a Bullish phase. Red candles represent a Bearish phase. Grey candles serve as Consolidation phases (within a Bullish or a Bearish phase), but sometimes they tend to form at the end of a trend. Candle colors are not predictive – they merely state what the current trend is. Indeed, the candle color can change in the next bar. False patterns can occur around the 200-period moving average, or around a support/resistance and/or in sideways/choppy market. The author does not guarantee the accuracy of the information. Past performance is not indicative of future performance. Users of the information do so at their own risk.

--- Written by Manish Jaradi, Strategist for DailyFX.com
--- Contact and follow Jaradi on Twitter: @JaradiManish