


Dow Jones Industrial Average, DAX 40 (DAX30), FTSE 100 and Rate Hike Talking Points:
- The Market Perspective: Dow Bearish Below 33, 150 and DAX Bearish Below 14,150
- The FOMC is expected to announce a 50 bp rate hike next Wednesday at 19:00 GMT, while the Bank of England and European Central Bank are expected produce similar the following day
- Anticipation seems to be amplifying holiday complacency, but the technical pictures form the benchmark Dow, DAX and FTSE should have traders are on guard

This week has been relatively light on high-profile event risk and the themes that have urged the market along on their trends have waned amid comfort in ‘seasonality’ influences. That said, I believe anticipation may be an even more potent influence on markets that may seem simply seem complacent. Next week, we are due the last big run of heavy event risk for the year; and the top listings are rate decisions from three of the largest central banks in the world: the FOMC (Wednesday at 19:00 GMT); the BOE (Thursday at 12:00 GMT) and ECB (Thursday at 13:15). All three are expected by economist consensus to hike their respective benchmarks by 50 basis points. That outcome will be well integrated into the market’s current pricing – even though all three of their respective benchmark indices (Dow Jones Industrial Average, DAX 40 and FTSE 100) are closer to record highs than they are their 2022 lows. The defining factors in how the markets respond will be: the market’s threshold for liquidity this late into the year; the forecasts for terminal rates from all three groups and the potential for building an overview of monetary policy for the global financial system from this group.
Of the three central banks, the Fed will carry the greatest weight for scaling beyond its own financial borders and out to the global picture of policy and market performance – not to mention it is also the first update to come down the line. Notably, the Dow index is significantly higher than its S&P 500 and Nasdaq 100 counterparts, relatively. That suggests an appetite for safety given that this is the blue chip index. That preference doesn’t bode well for the general state of risk appetite in the markets. Rather it reads like a market that is living by the axiom that you always need to have exposure, but is not really confident in the course the markets are on. The risk is greater to the downside with liquidity thinning out as fear is more potent a sentiment than greed. Further, the Dow has formed what could be called a head-and-shoulders pattern after its remarkable run these past few months and just after earning a technical ‘bull market’ (20 percent from significant lows). At present, the 20-day historical range as a percentage of spot is extremely low and likely adds to its proneness to a break.
| Change in | Longs | Shorts | OI |
| Daily | -18% | 18% | 7% |
| Weekly | -19% | 14% | 4% |
Chart of Dow Jones Industrial Average with 20-Day SMA and 20-Day Historical Range (Daily)
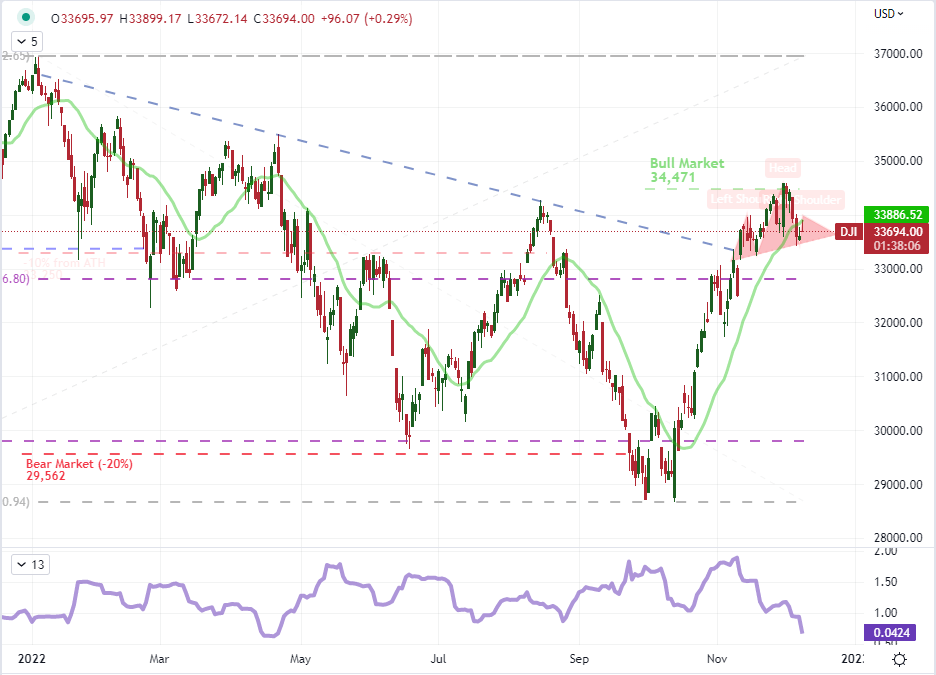
Chart Created on Tradingview Platform
In mainland Europe, the ECB seems to have much more to consider in its monetary policy spectrum. The economic outlook as assessed by supranational groups like the IMF is most troubled for the Eurozone relative to its peers and the messaging from the central bank has been particularly uneven. Forward guidance can help steer expectations for the market even when the eventual outcome would not be favorable for growth or capital markets. The 50 basis point rate hike forecast seem to be fairly well established, but there is considerable debate over the central bank’s intentions and ability to close the gap to the Fed (something the OECD suggested recently) with a current benchmark rate that is significantly lower than its US counterpart. Should the ECB escalate its inflation fight with remarks that the economy or energy crisis are not as severe as was anticipated, it could tip off the negative correlation that typically exists between interest rates and capital markets. Here too, the greatest ‘risk’ of volatility would be a sharp move to the downside (rather than a break from range higher), and there is a midpoint of the 2022 range stationed not far below the past month’s congestion.
| Change in | Longs | Shorts | OI |
| Daily | -9% | 7% | 2% |
| Weekly | -27% | 9% | -5% |
Chart of DAX 40 with 20-Day SMA, 5-Day to 60-Day ATR Ratio (Daily)
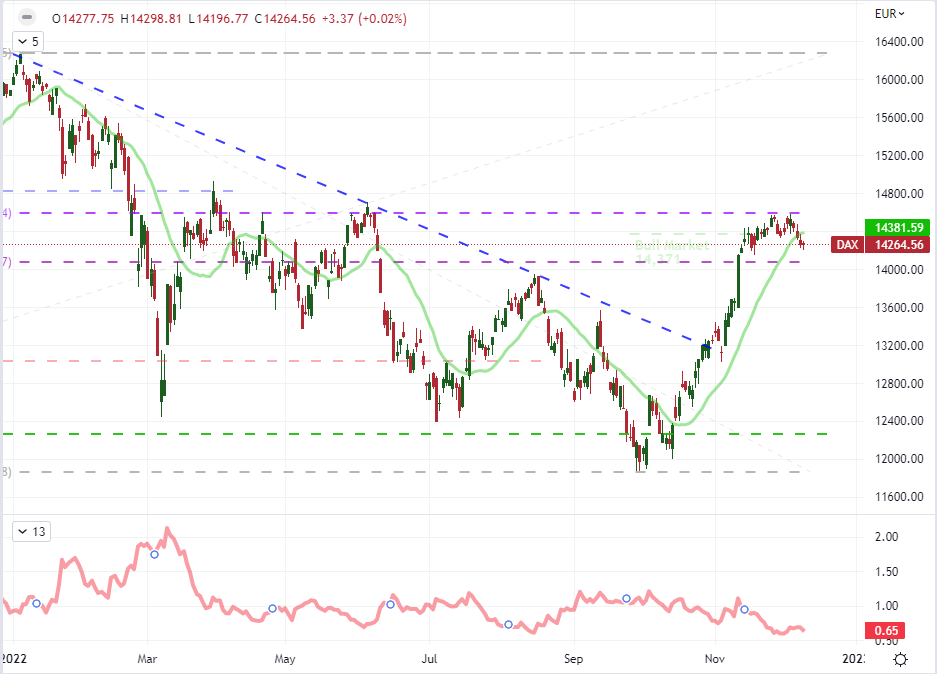
Chart Created on Tradingview Platform
For the UK’s FTSE 100, the relative performance is notable when you consider the index never entered a technical ‘bear market’ (20 percent off systemic or all-time highs) and the subsequent rebound we have seen is near the very top of its 2022 range. This is particularly remarkable performance given the state of politics (the minibudget fiasco), extremely high inflation pressures and the general economic malaise that is afflicting much of the developed world. It would seem that this index – and investor sentiment generally – is more fundamentally resilient; but it that does not mean it is totally unmoored from the ebb and flow of economy and financial health. A break towards – and certainly above – 7,700 would be an insinuation of great enthusiasm that would seem to defy the core picture of the global investment landscape. From a technical perspective, this is a very large range that we are in; and we have recently started to round off near the upper threshold.
| Change in | Longs | Shorts | OI |
| Daily | -30% | 25% | 2% |
| Weekly | -44% | 44% | 0% |
Chart of UK’s FTSE 100 Index with 20-Day SMA and 20-Day Rate of Change (Daily)
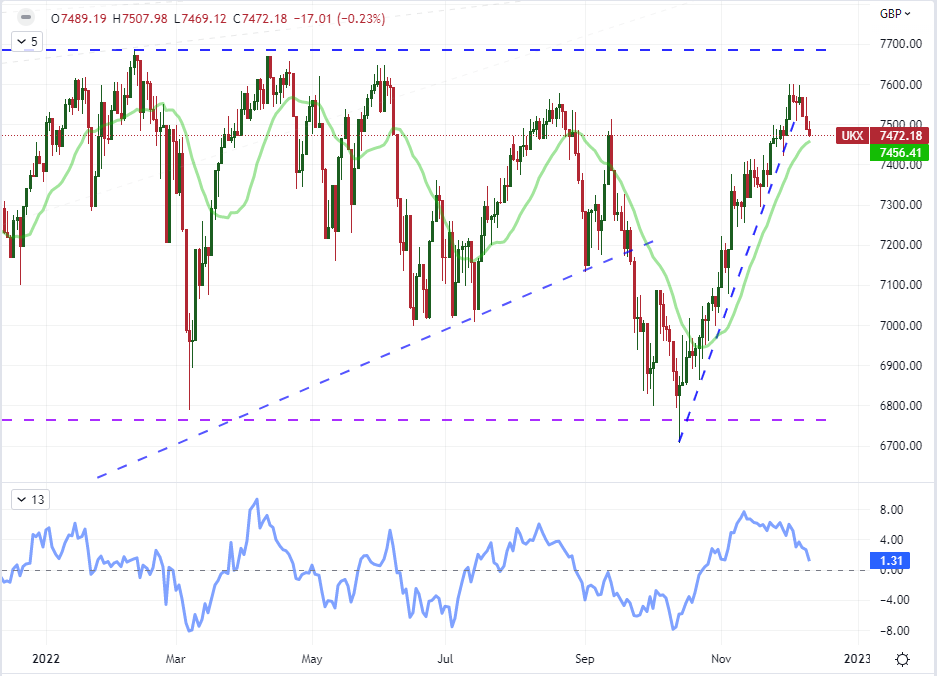
Chart Created on Tradingview Platform
Trade Smarter - Sign up for the DailyFX Newsletter
Receive timely and compelling market commentary from the DailyFX team


