


British Pound Talking Points:
- GBP continues to get driven by headlines with this morning’s announcement of yet another leadership change at the PM spot for the UK.
- While GBP/USD has shown a number of short-term trends of late, longer-term price action continues to consolidate inside of the range built in late-September through early-October. GBP/JPY is testing a significant long-term resistance level and EUR/GBP presents some interest on a longer-term look.
- The analysis contained in article relies on price action and chart formations. To learn more about price action or chart patterns, check out our DailyFX Education section.

There’s more turmoil in UK headlines as this morning brings yet another leadership change at No. 10 with the announcement that Liz Truss was resigning as PM. Judging by GBP price action, this doesn’t seem to have been a significant surprise. GBP/USD has so far seen a small boost on the back of that news but this is in the confines of the bigger-picture, which has largely been consolidation since the GBP/USD collapse in late-September pulled back into the 1.1500 area of resistance.
Since then, there’s been a number of turns to work with but these have largely been relegated to shorter-term swings. After the 1.1500 resistance test, price pulled back to find support at prior resistance around 1.0932. That led into a bounce into 1.1350, which bulls tried but failed to break-through on a few different occasions. That led to another dip to support and this was at a higher-low, keeping on the theme of consolidation; and that’s leading into this morning’s bounce on the back of the leadership headline.
At this point, intermediate-term GBP/USD remains in a symmetrical triangle formation.
GBP/USD Daily Chart
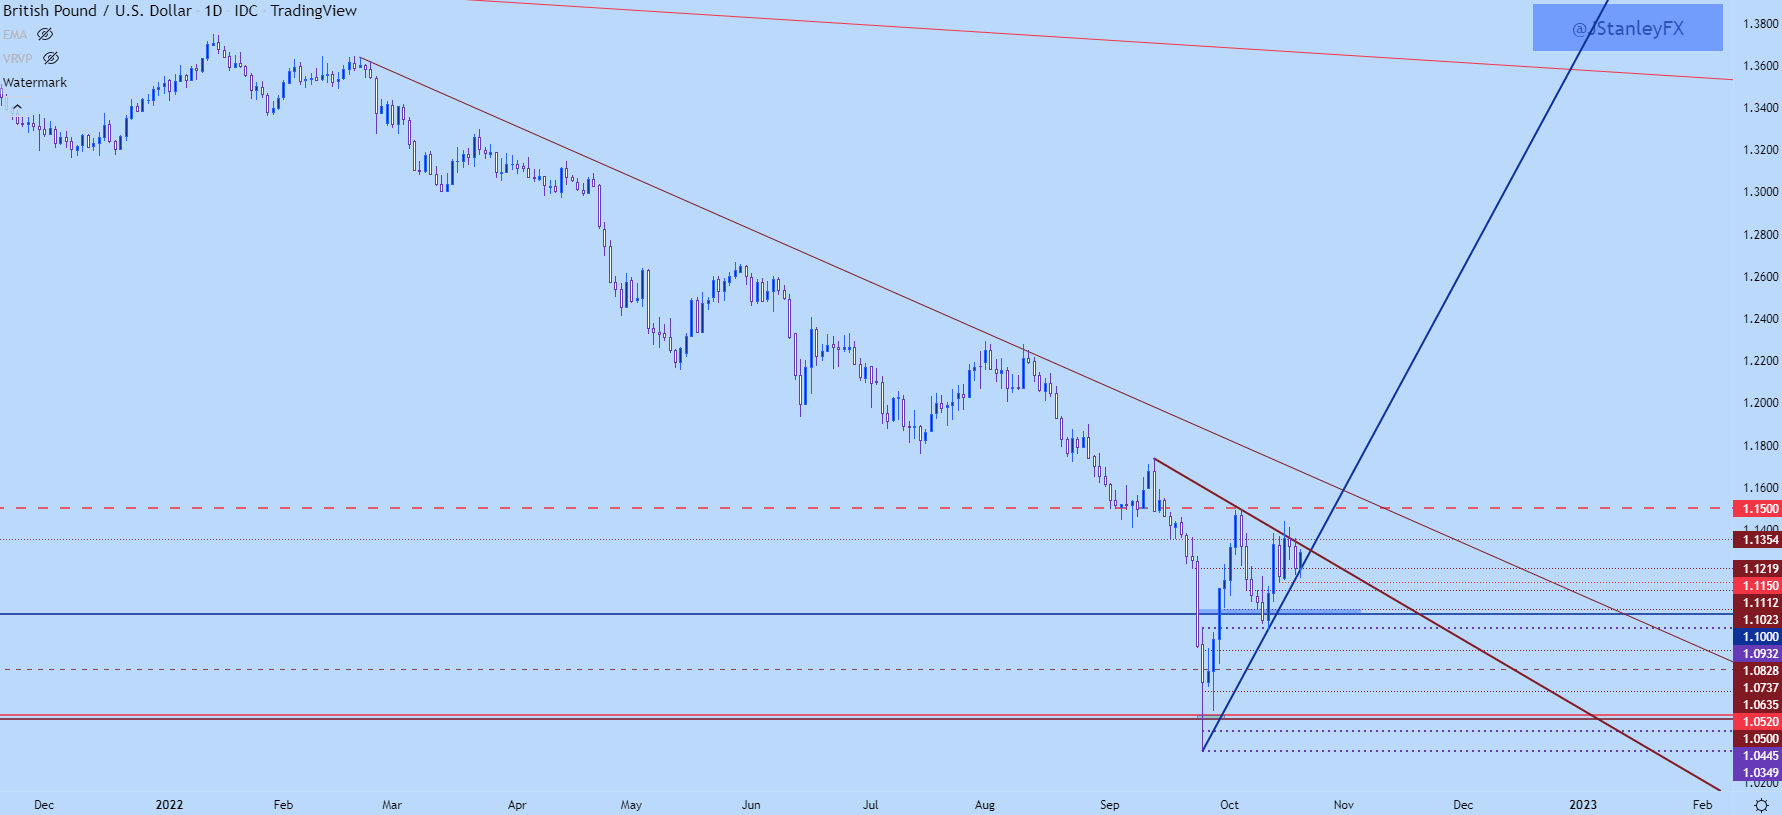
Chart prepared by James Stanley; GBPUSD on Tradingview
GBP/USD Shorter-Term
Inside of this consolidation, however, has been a number of short-term swings. This morning’s bounce is showing at a familiar area of resistance-turned-support. That plots from around 1.1180-1.1210 and this is the same zone that helped to hold support at the end of last week.
But, notably, as price works deeper within the symmetrical triangle the size of each swing has continued to diminish, which isn’t all that abnormal for consolidation patterns. This will generally lead to a break in one direction or the other but as is standard with a symmetrical triangle, there’s not always a strong prevailing bias that can be used to anticipate the direction of the formation’s break.
It did look as though bulls were going to test for a breakout yesterday but price quickly pulled back inside of the formation. And then this morning’s support grind was similarly testing the bottom of the formation without any clear breaks.
This can give a bit of scope to shorter-term setups, looking for breaks of the 1.1350 resistance level of the 1.1180 support level before looking to push directional themes in the pair.
A bullish break of 1.1350 would look to a re-test of yesterday’s high at 1.1440 and then the longer-term zone that runs from 1.1460-1.1500. On the support side of the matter, a breach of 1.1180 opens the door for a move to next support around 1.1112, after which the 1.1000-1.1025 zone comes into the picture.

GBP/USD Four-Hour Chart
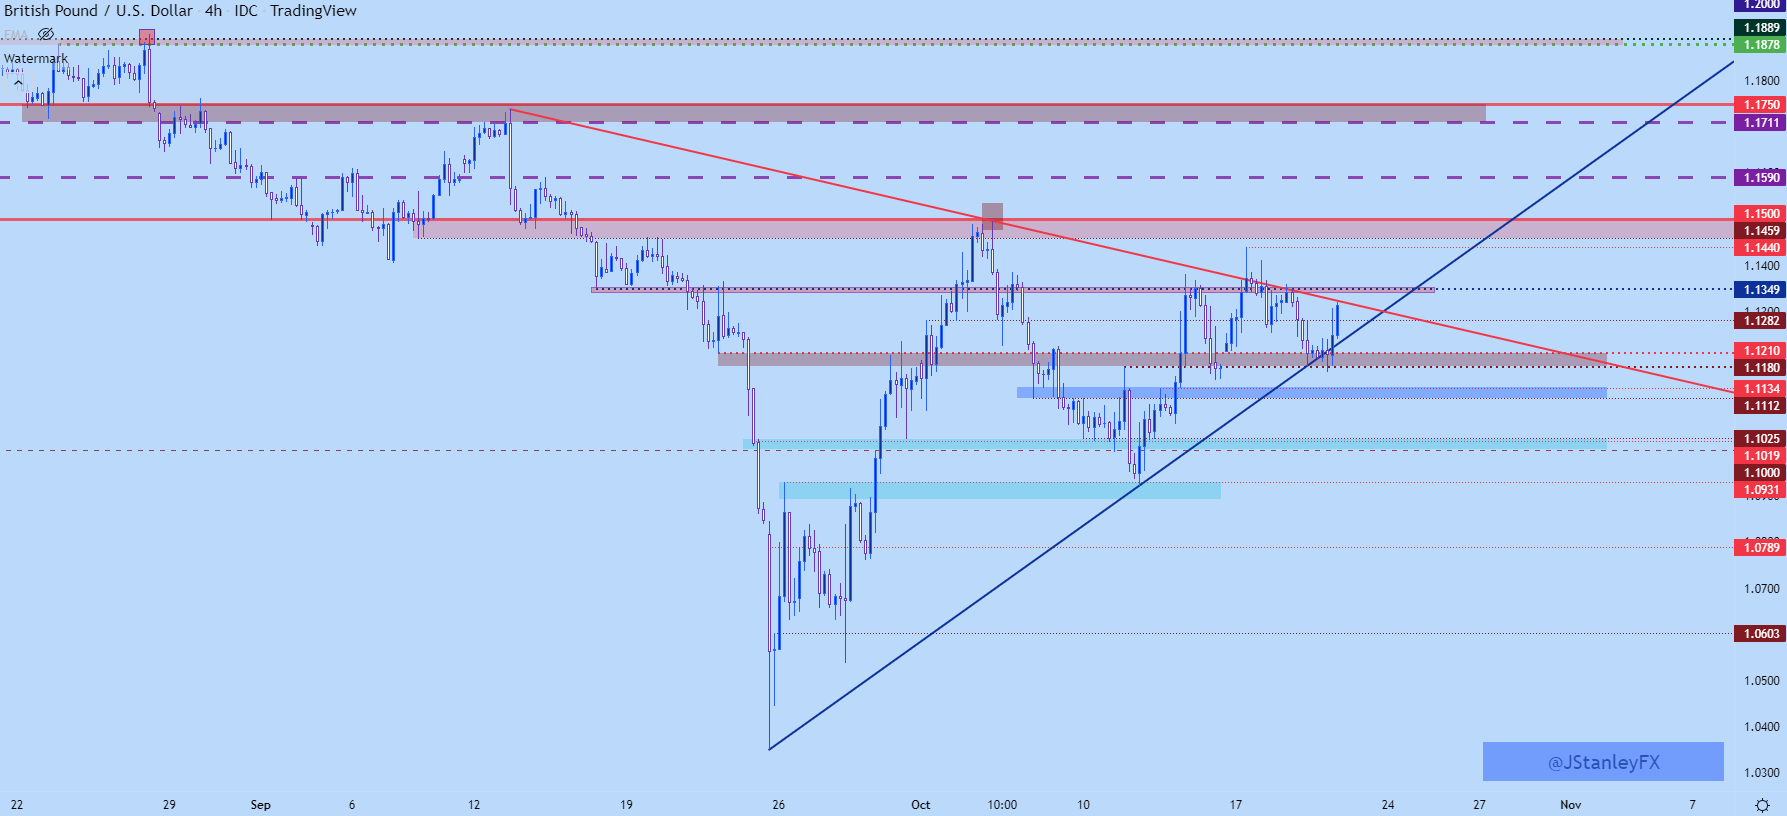
Chart prepared by James Stanley; GBPUSD on Tradingview
GBP/JPY
If you’re looking for extreme volatility, GBP/JPY may be your pair…
I had looked at this right after the collapse-like move in GBP in late-September, just after GBP/JPY had jumped down to a major support area around two-year-lows. That support is all the way down below the 149 level which is more than 2,000 pips away from current price.
And at this point, GBP/JPY is trading very near a recently-established six-year-high, testing above a Fibonacci level that held advances in April and June, producing sizable pullbacks each time. We saw this zone first tested through on Monday, with price pushing all the way up for a test of the 170.00 psychological level, which was then followed by a pullback.
But, notice how that pullback continued to find support right around the same Fibonacci level at 168.06 and today is pushing-higher, giving the appearance of another breakout test at 170.00 that may soon be on the way.
GBP/JPY Daily Price Chart
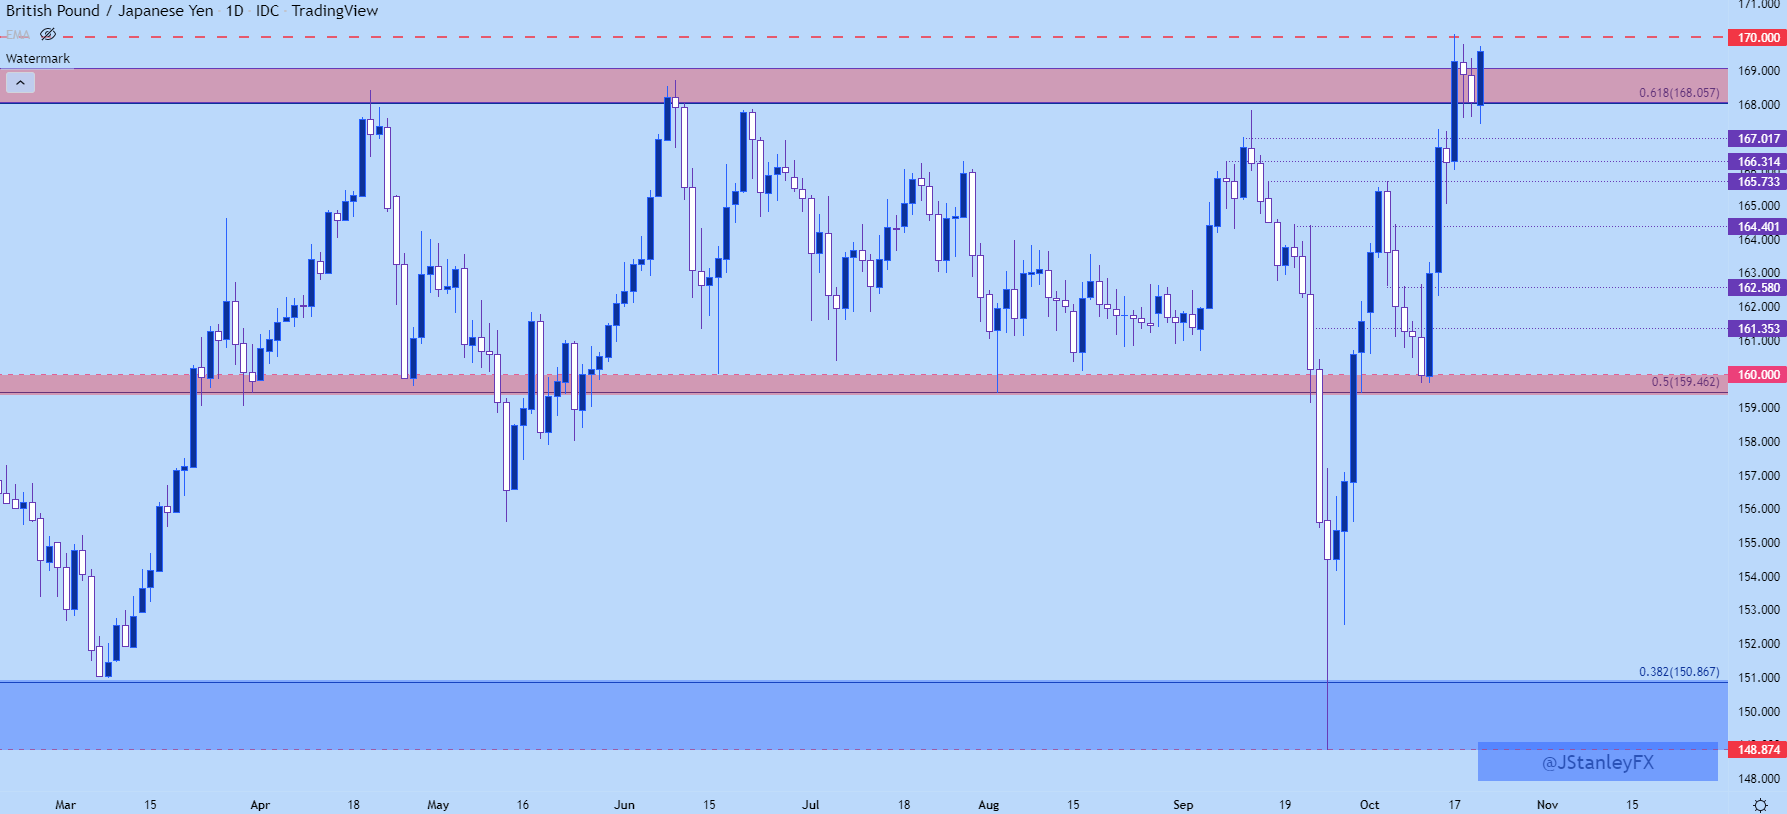
Chart prepared by James Stanley; GBPJPY on Tradingview
GBP/JPY Longer-Term
That 170.00 level in GBP/JPY is a big deal and perhaps more to the point, we can put some scope around just how extreme this recent move has been, following last month’s long-legged doji that, so far, has seen some brisk topside continuation so far through the first few weeks of October.
But, this also highlights how the breakout has been a theme that’s been brewing for the past few months as this current resistance zone held bulls in April and June and is now being traded through. This keeps the door open for topside breakout potential until we see some form of shift around the Bank of Japan. But, on that topic, caution is warranted as the USD/JPY pair is now testing the 150.00 level which raises questions around how policy-makers in Japan might handle the matter.
But, similar to USD/JPY, if there is another intervention such as we saw on 9/22, without any changes to policy, there could still remain bullish motive given the positive carry on the long side of the pair.

GBP/JPY Monthly Price Chart
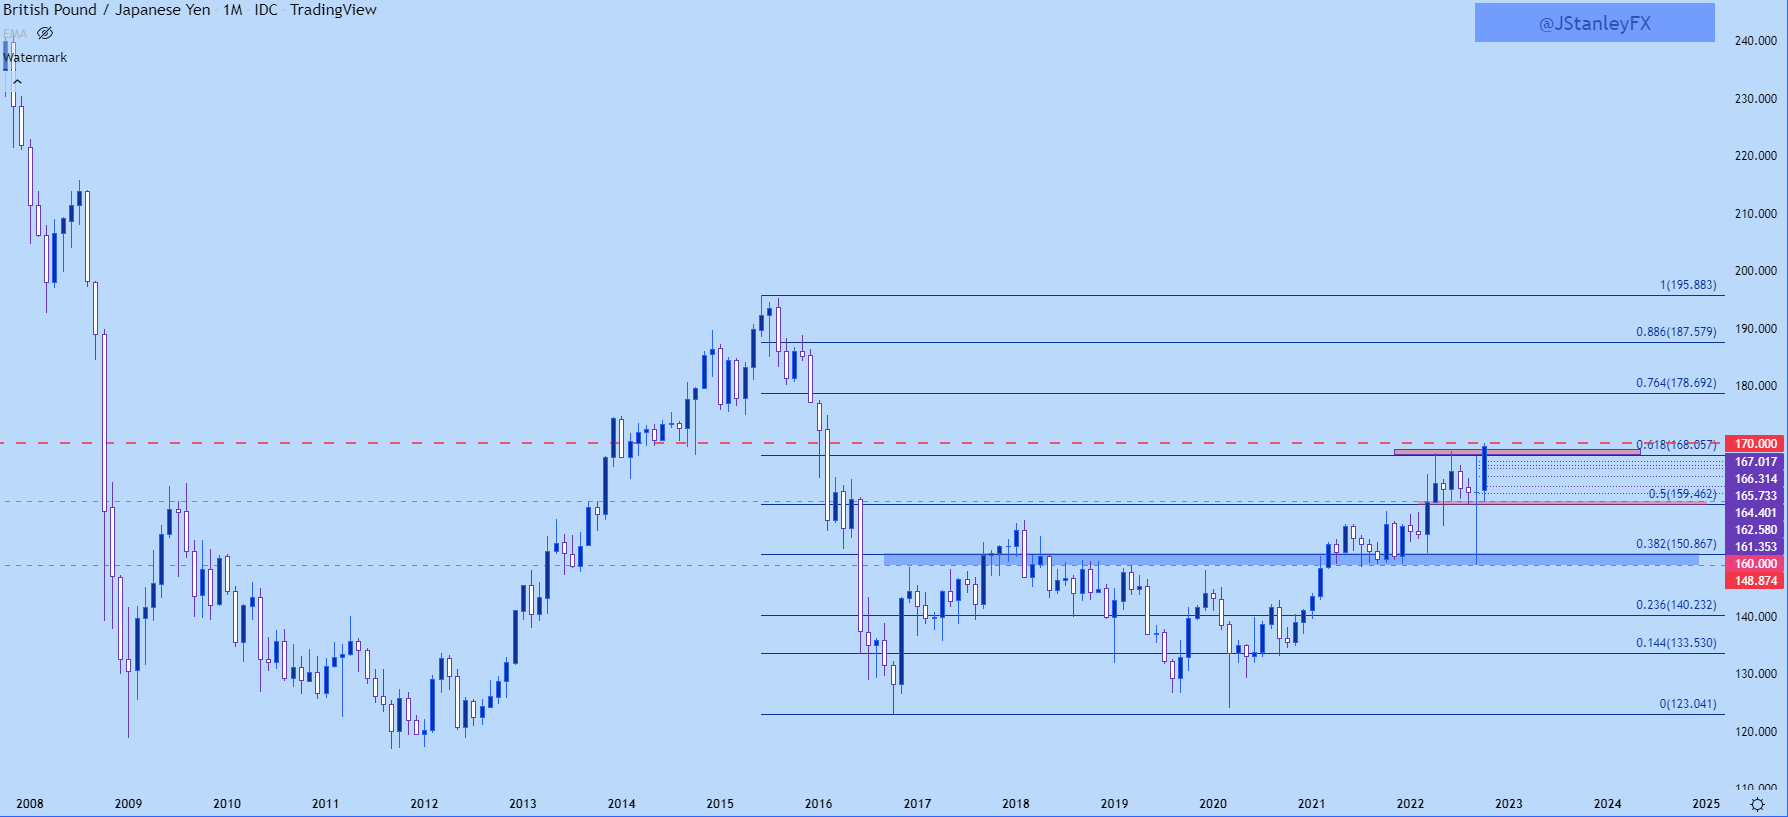
Chart prepared by James Stanley; GBPJPY on Tradingview
EUR/GBP
We’ve heard a lot about headlines out of the UK of late but, is Europe really in that much of a better spot? Granted, the leadership turmoil around the PM spot is somewhat exceptional, but if we look at the economic backdrop around the Eurozone at the moment the argument can be made that there’s an equally daunting road ahead.
So it was somewhat surprising, at least to me, to see EUR/GBP flare so aggressively on the back of the late-September dynamics. Price action did adhere to the previously-defined range, which has been in-place for more than five years now, but price moved all the way up for a test of two-year-highs at .9270.
Since then we’ve seen a bit of settling. Right now prices are working through a mid-line area in that recent range, with longer-term support lurking below, around the .8371 level. And there may be some near-term dynamics that can be worked with which I’ll look at on the next chart.
EUR/GBP Monthly Chart
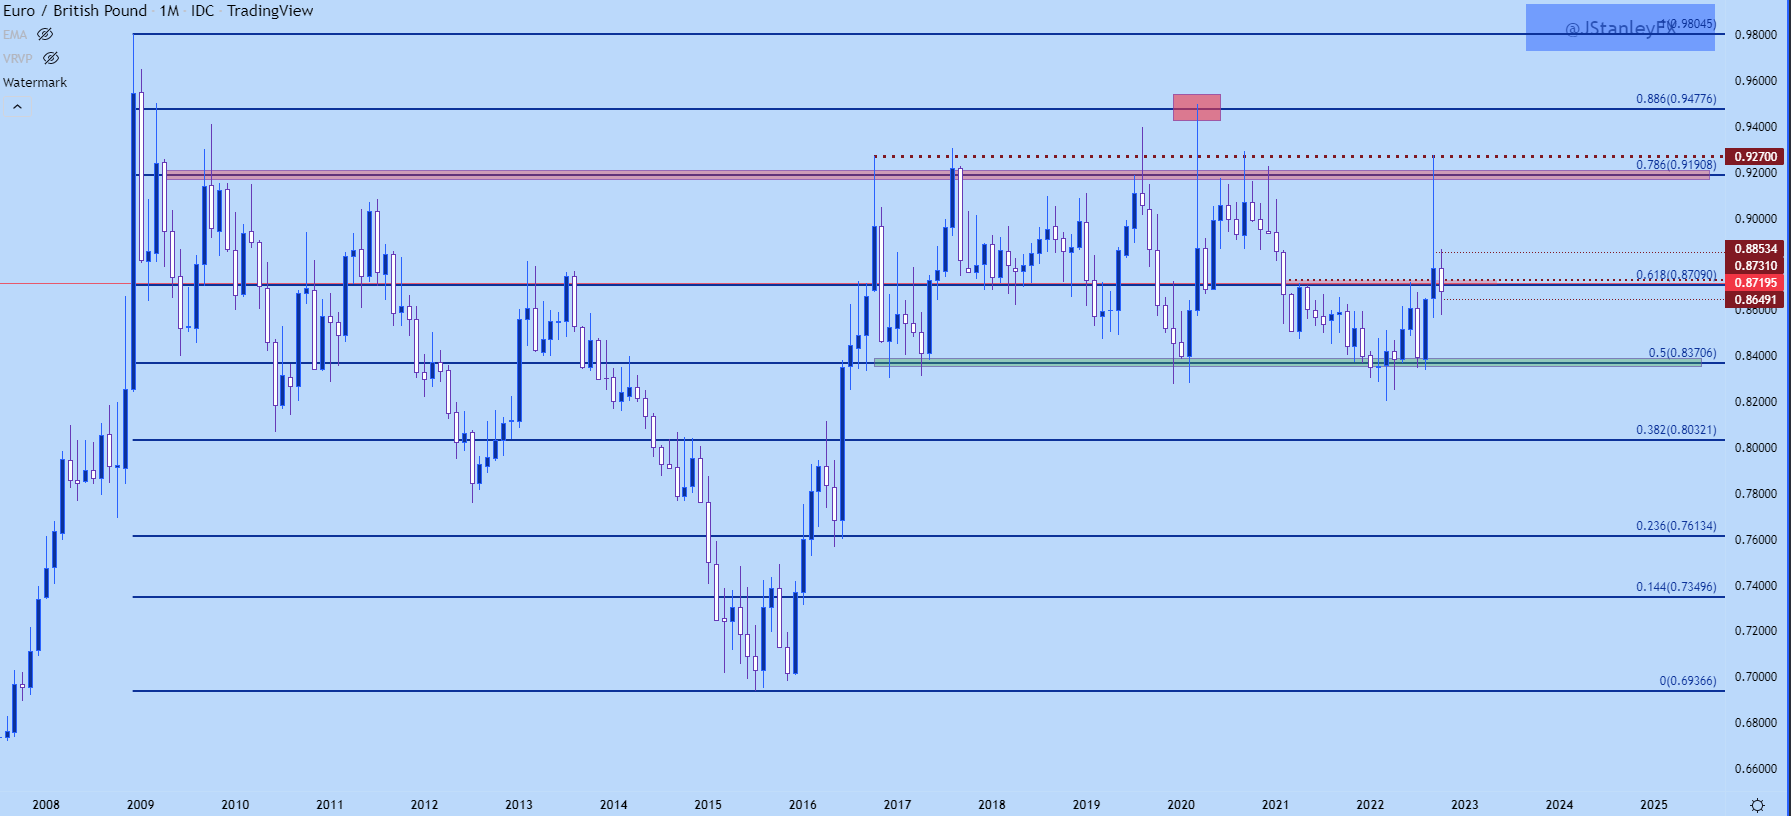
Chart prepared by James Stanley; EURGBP on Tradingview
EUR/GBP Shorter-Term
From the daily chart below, we can see a recent series of lower-lows and lower-highs. This morning may be another one of those lower-high tests as we’re seeing a reaction at the 61.8 Fibonacci retracement that’s been functioning similar to a mid-line in this range.
This puts focus on the next item of support, around .8650, which then opens the door for support at .8585. After that, the .8500 psychological level comes into the picture and then the Fibonacci level at .8371.
EUR/GBP Daily Price Chart
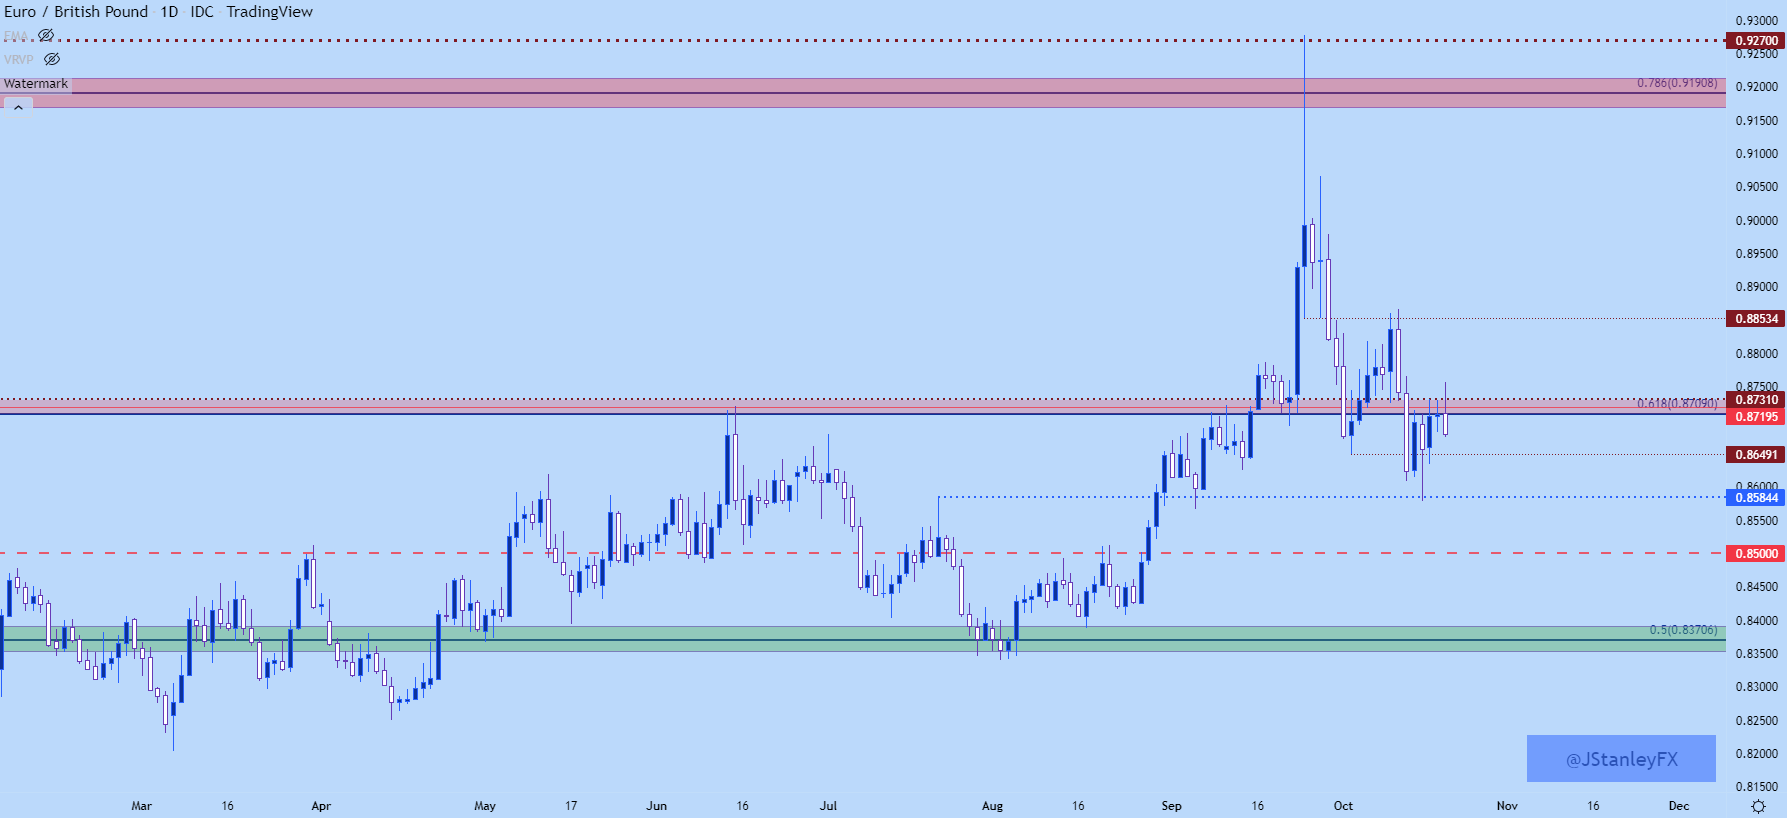
Chart prepared by James Stanley; EURGBP on Tradingview
--- Written by James Stanley, Senior Strategist, DailyFX.com & Head of DailyFX Education
Contact and follow James on Twitter: @JStanleyFX


