


British Pound Talking Points:
- The British Pound continued to recover into last week, with matters turning after GBP/USD was rejected at the 1.1500 psychological level. Already the pair is back down around the 1.1000 handle.
- GBP/JPY has been mired in extreme volatility with last month’s candle taking on a range of almost 1,900 pips or 11% of the spot value of GBP/JPY. Major levels were at-play for both support and resistance.
- EUR/GBP remains of interest on the basis of longer-term dynamics. The resistance looked at a couple weeks ago during the GBP meltdown helped to bring on a fast reversal, but a support level is now in the picture that can possibly have a bearing in this week’s price action.
- The analysis contained in article relies on price action and chart formations. To learn more about price action or chart patterns, check out our DailyFX Education section.

It was a tail of two trends last week in GBP/USD. The pair came into the week continuing the recovery from the late-September meltdown. And the move was fairly clean and consistent on the way up, all the way until the 1.1500 level came into play after which sellers started to take-control again.
By Thursday, the trend had already started to break back-down. As we open this week, price has made a move back towards the 1.1000 psychological level, falling below a key trendline along the way.
GBP/USD Four-Hour Chart
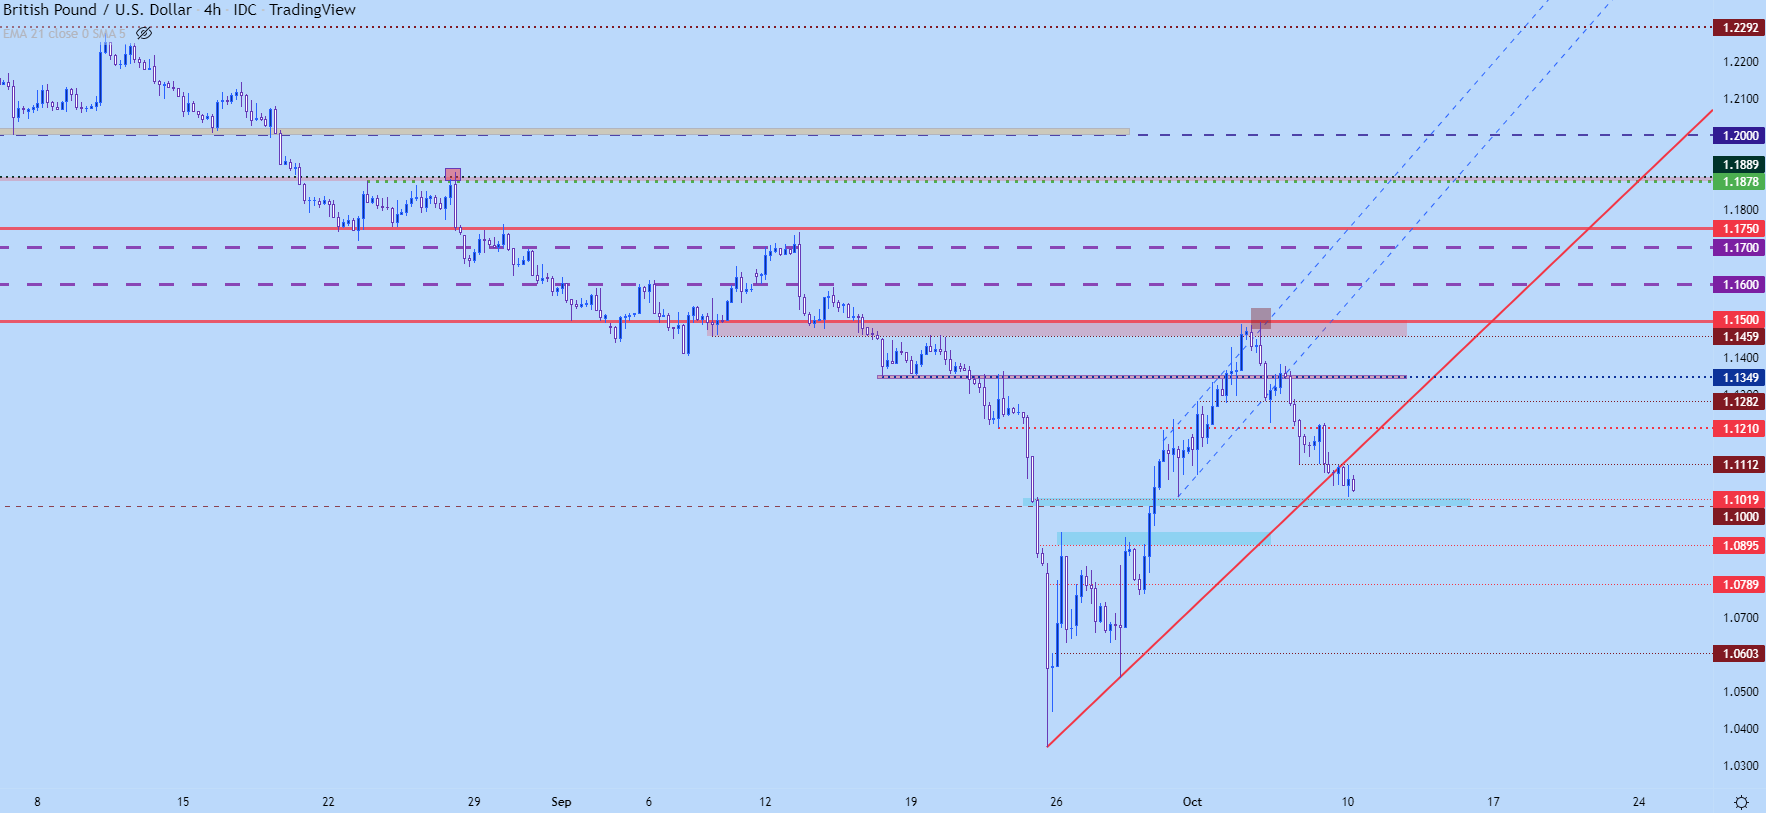
Chart prepared by James Stanley; GBPUSD on Tradingview
GBP/USD: Look Back to Think Forward
Given the extreme moves that have been seen in the pair, a step back on the chart can help to get some clarity.
The collapse move in late-September flung price action down to fresh all-time-lows here but there wasn’t much run below the 1.0500 psychological level.
And last week’s move looks rather extreme, as well, with the reversal hitting after the 1.1500 level came into play. So, the question is whether we’re in for another meltdown-like move in GBP/USD, which cannot be ruled out. But, that 1.1000 level will be a key point of emphasis along the way, and if sellers can budge through that, there’s a shorter-term level of interest at 1.0932, after which price action swings come into the picture at 1.0828 and 1.0737. Below 1.0737, next would be 1.0635 and then that 1.0500 psychological level.
On the resistance side of the coin, the support levels from the recovery move come into the picture and that plots around 1.1219 and then 1.1414, which was previously the 37-year-low until the late-September breakdown in the pair.
GBP/USD Weekly Chart
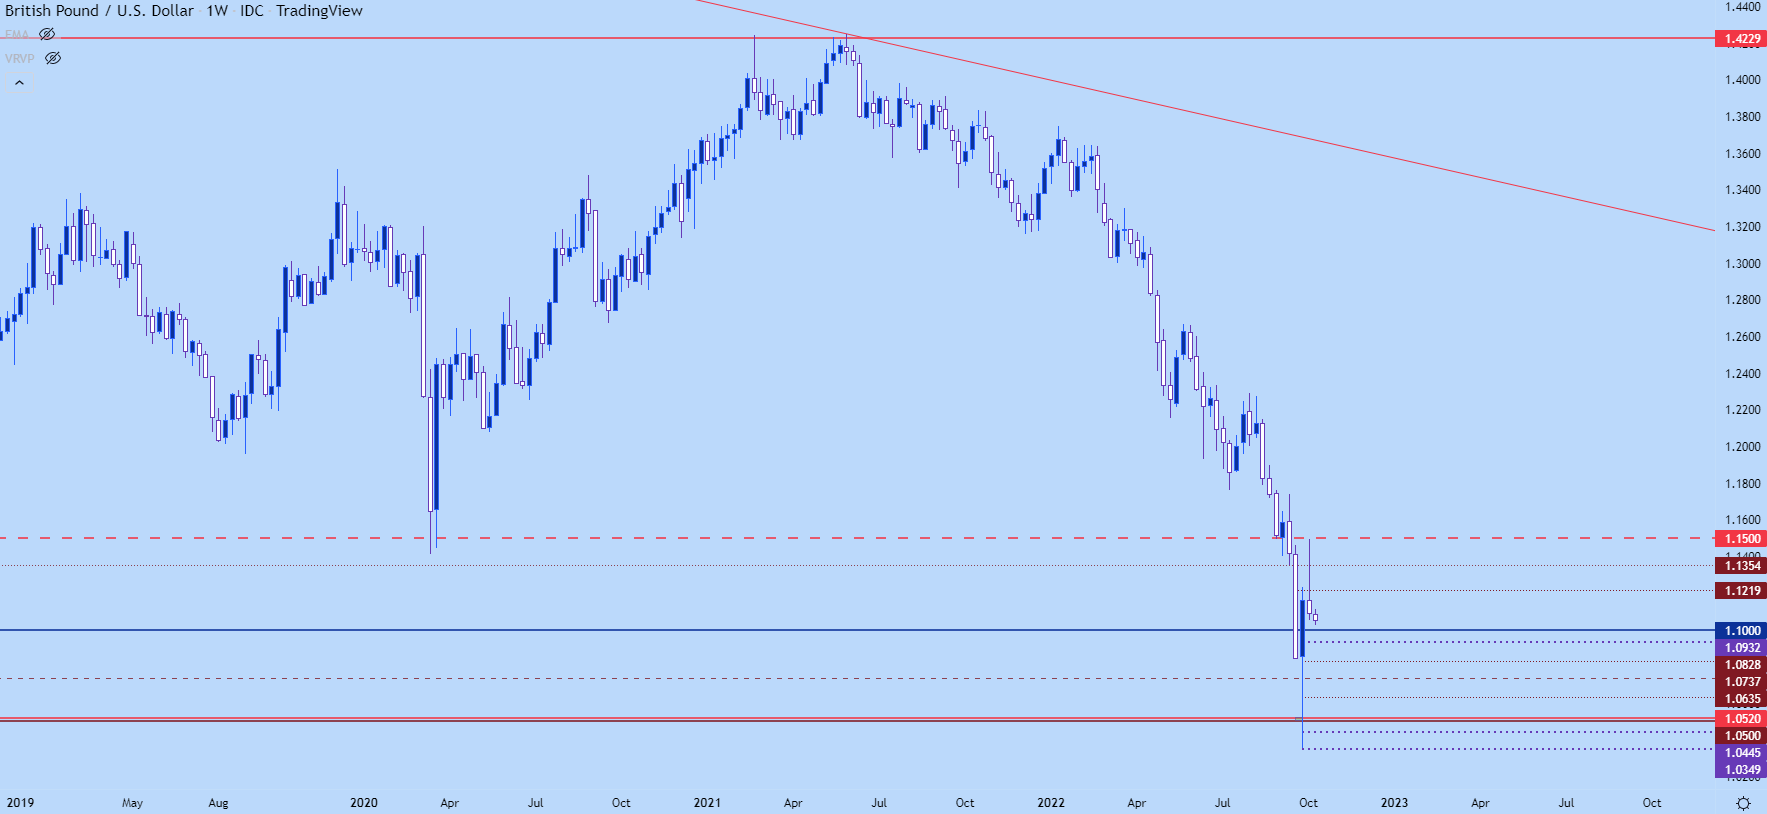
Chart prepared by James Stanley; GBPUSD on Tradingview
GBP/USD Shorter-Term
From the four-hour chart below, we can get some greater granularity on GBP/USD price action and that 1.1219 level remains as a key point of resistance potential. Current support is showing just above the 1.1000 psychological level and sellers have been fairly consistent since the reversal last Wednesday.
A break of the bearish trendline highlights a short-term pullback move, which opens the door for a revisit to the 1.1219 area. There’s a shorter-term swing along the way at 1.1112 and above the 1.1219, I’m tracking 1.1354 as resistance.

GBP/USD Four-Hour Chart
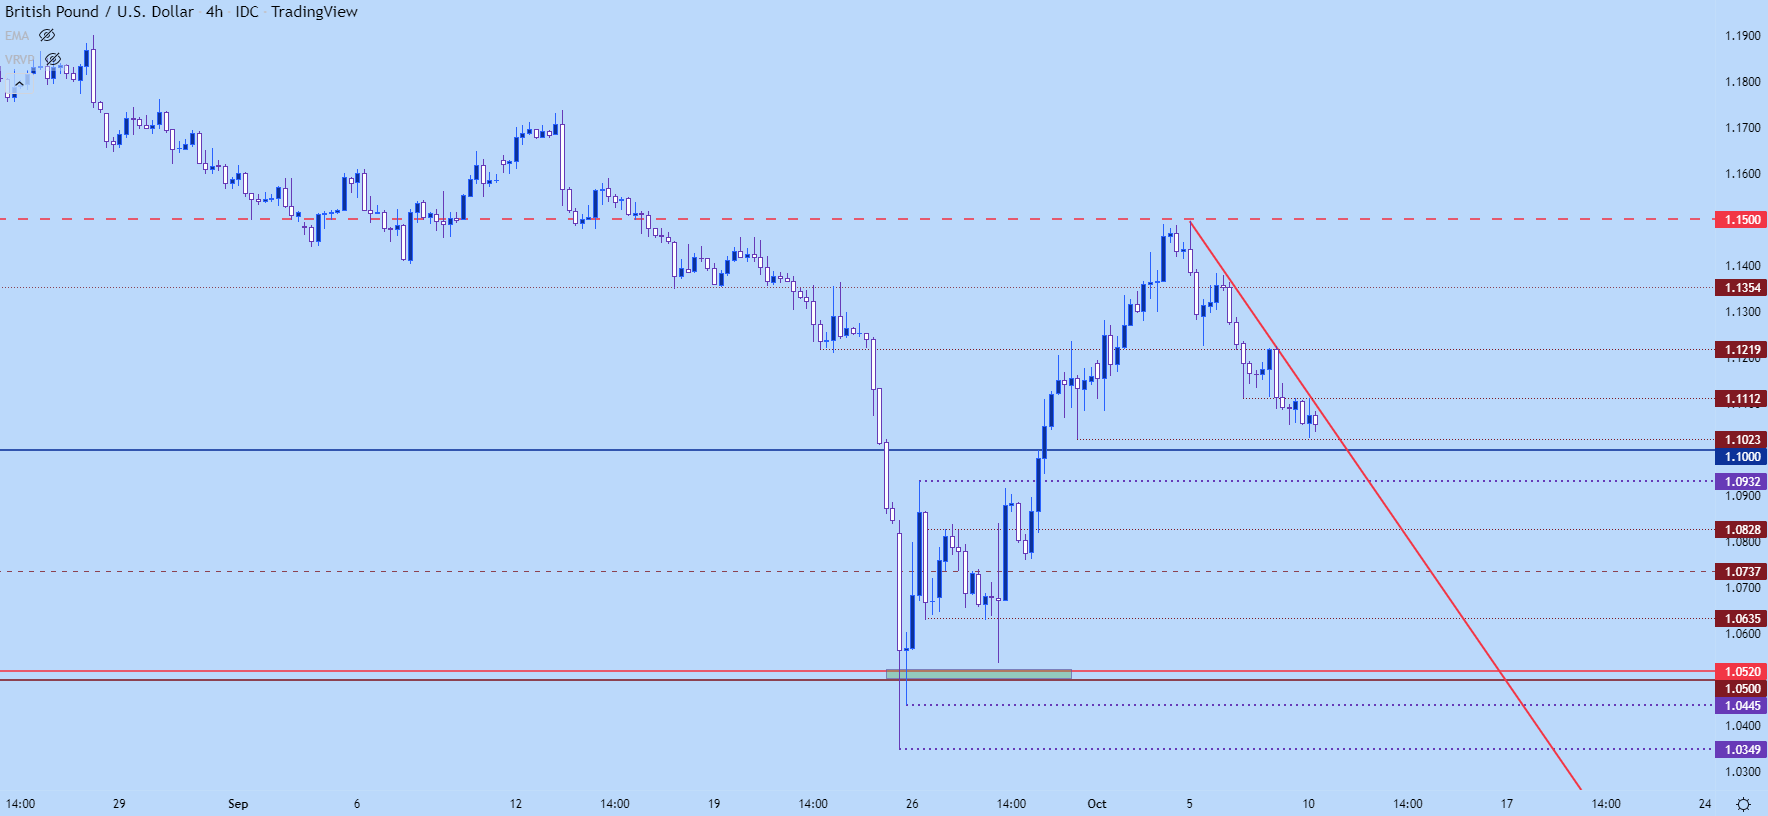
Chart prepared by James Stanley; GBPUSD on Tradingview
GBP/JPY
GBP/JPY is generally a volatile currency pair. So, when price action had spent much of the past six months grinding in a relatively tight range, it looked prime for a major break, at some point.
Last month saw that volatility begin to show although it did it in a rather nullified manner as the September bar closed as a long-legged doji, and it’s probably one of the longest-legged dojis that I’ve ever seen on a monthly chart. The total range for September was almost 1,900 pips, which constitutes 11.31% of the pair’s spot value.
There’s a key level in-play here, taken from around 165.69 which is the 38.2% Fibonacci retracement of the 2011-2015 major move. That helped to hold the highs last week and, bigger picture, over the past six months.
GBP/JPY Monthly Chart
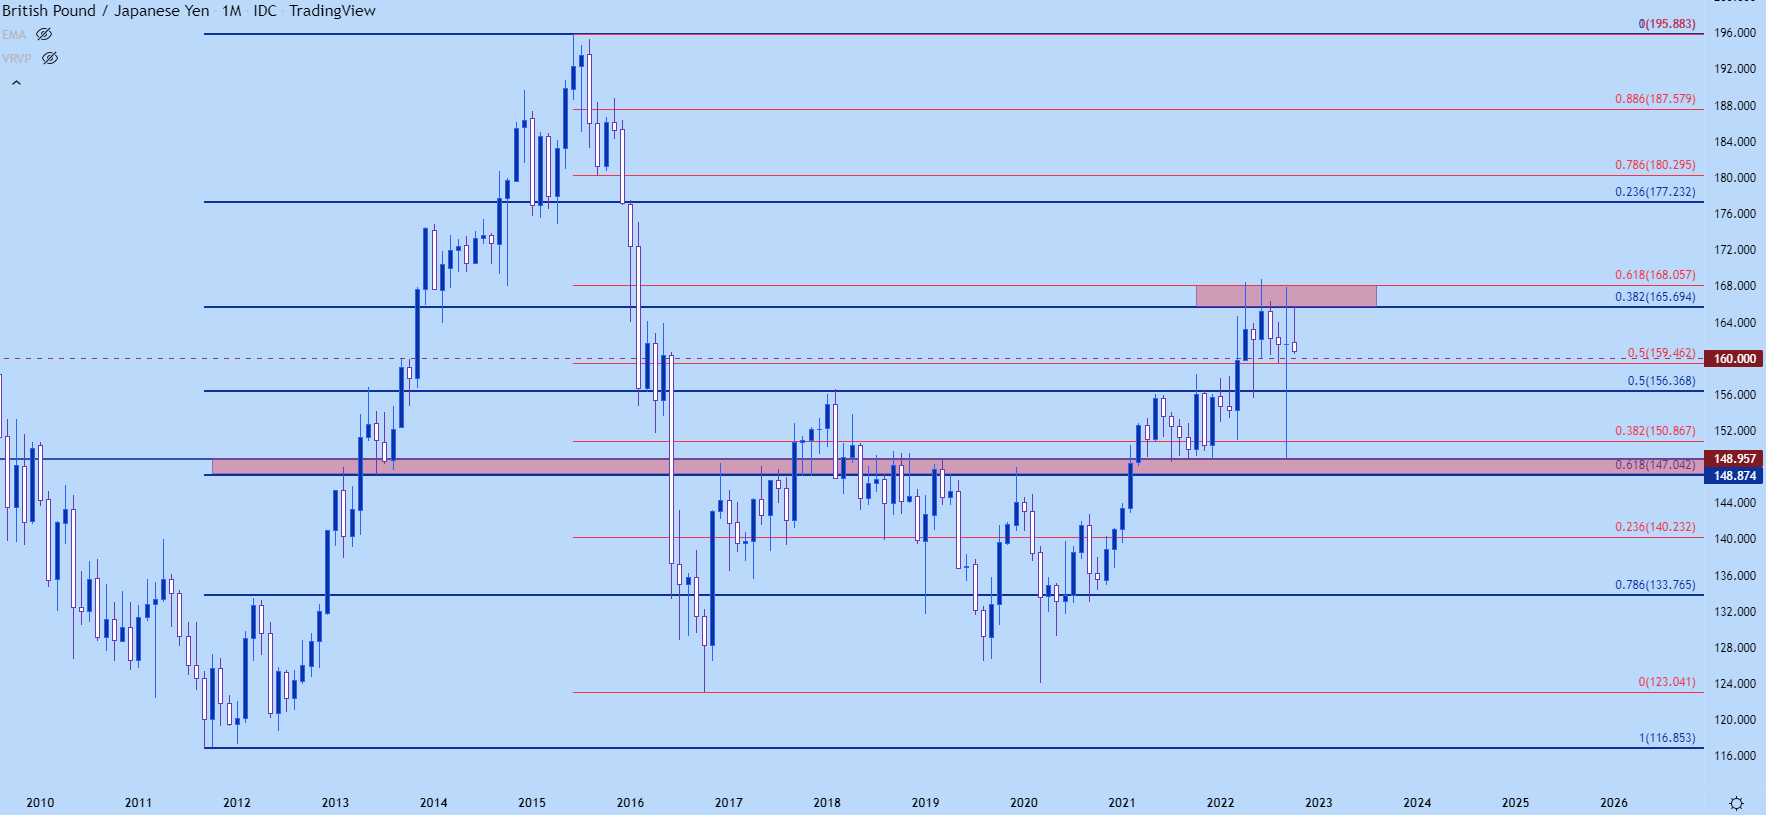
Chart prepared by James Stanley; GBPJPY on Tradingview
GBP/JPY Daily
From the daily chart below we can see truly how one-sided these moves have been – from a steep drop to a strong rally to another drop.
The next area of support coming into play is the 160 psychological level, which had functioned for support from June to September, until that breakdown move showed up. Below that, my next major level is all the way down at 156.37.
It seems that volatility is waking up in the pair and given the intense focus on currency items in both Japan and the UK, we may be closer to the start of a vol increase as opposed to the end.
GBP/JPY Daily Chart
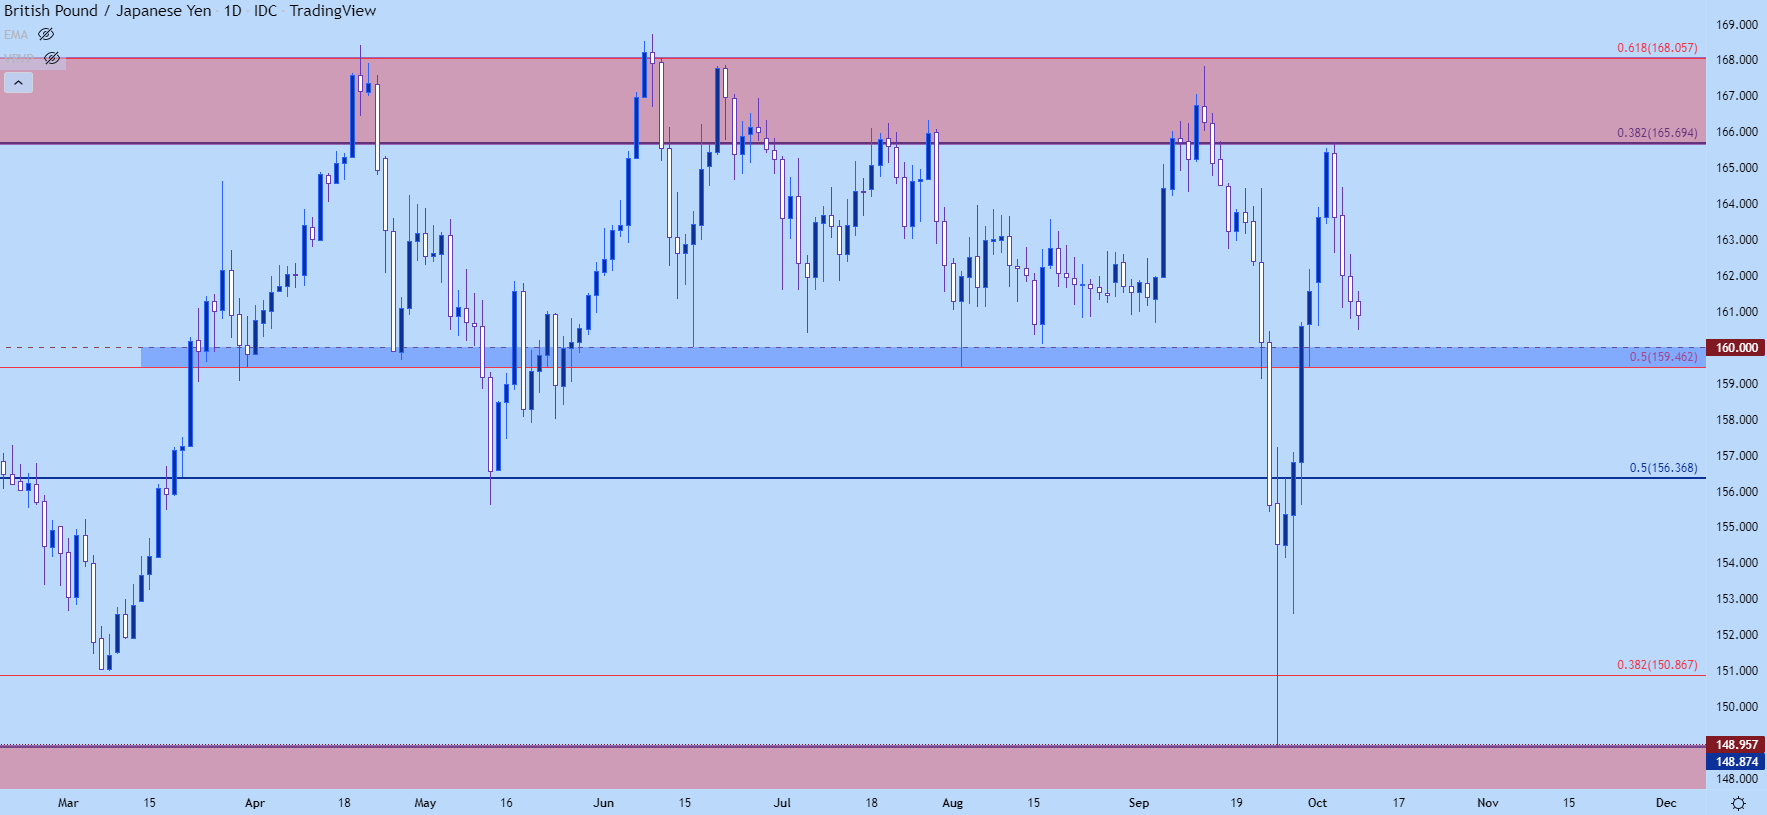
Chart prepared by James Stanley; GBPJPY on Tradingview
EUR/GBP
EUR/GBP is usually a pair that I consider for mean reversion scenarios. Particularly over the past five years, the pair has been range-bound between support at .8371 and resistance at .9191, both levels produced by a Fibonacci retracement spanning from the 2008 high down to the 2015 low.
In between those two prices, however, is a 61.8% Fibonacci retracement level that’s also shown a penchant for support. That’s started to come into play this month.
EUR/GBP Monthly Chart
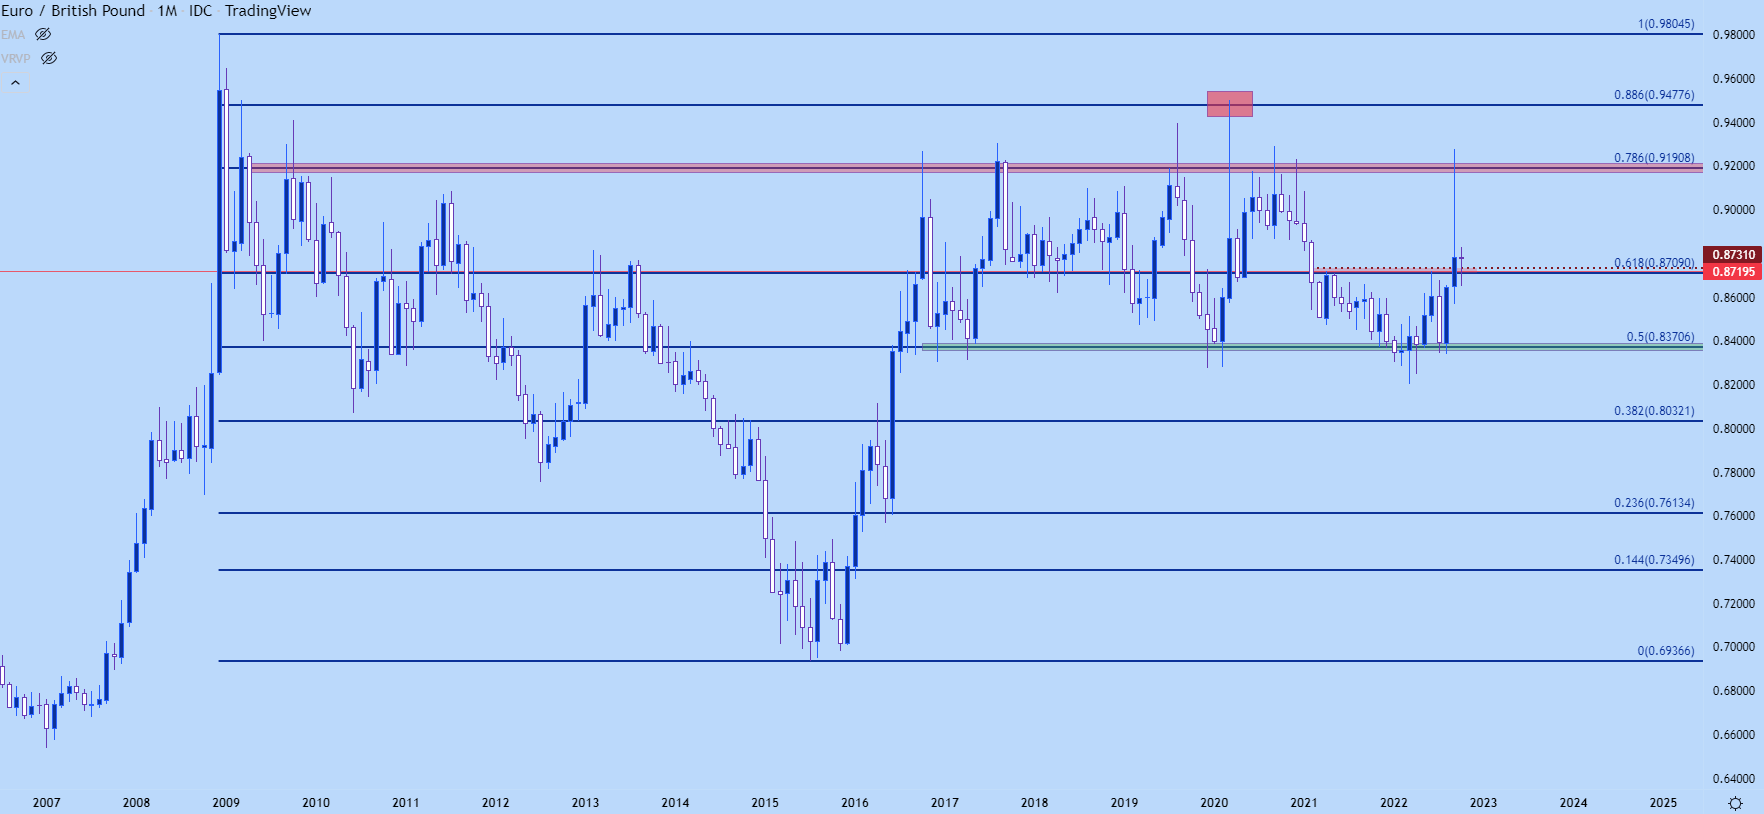
Chart prepared by James Stanley; EURGBP on Tradingview
EUR/GBP
Last week’s candle finished as a doji following that snap-back move. This keeps the door open for shorter-term support at that 61.8 level, in essence playing mid-line of a recent range; but this would be an item likely relegated for GBP-bears.
EUR/GBP Weekly Chart
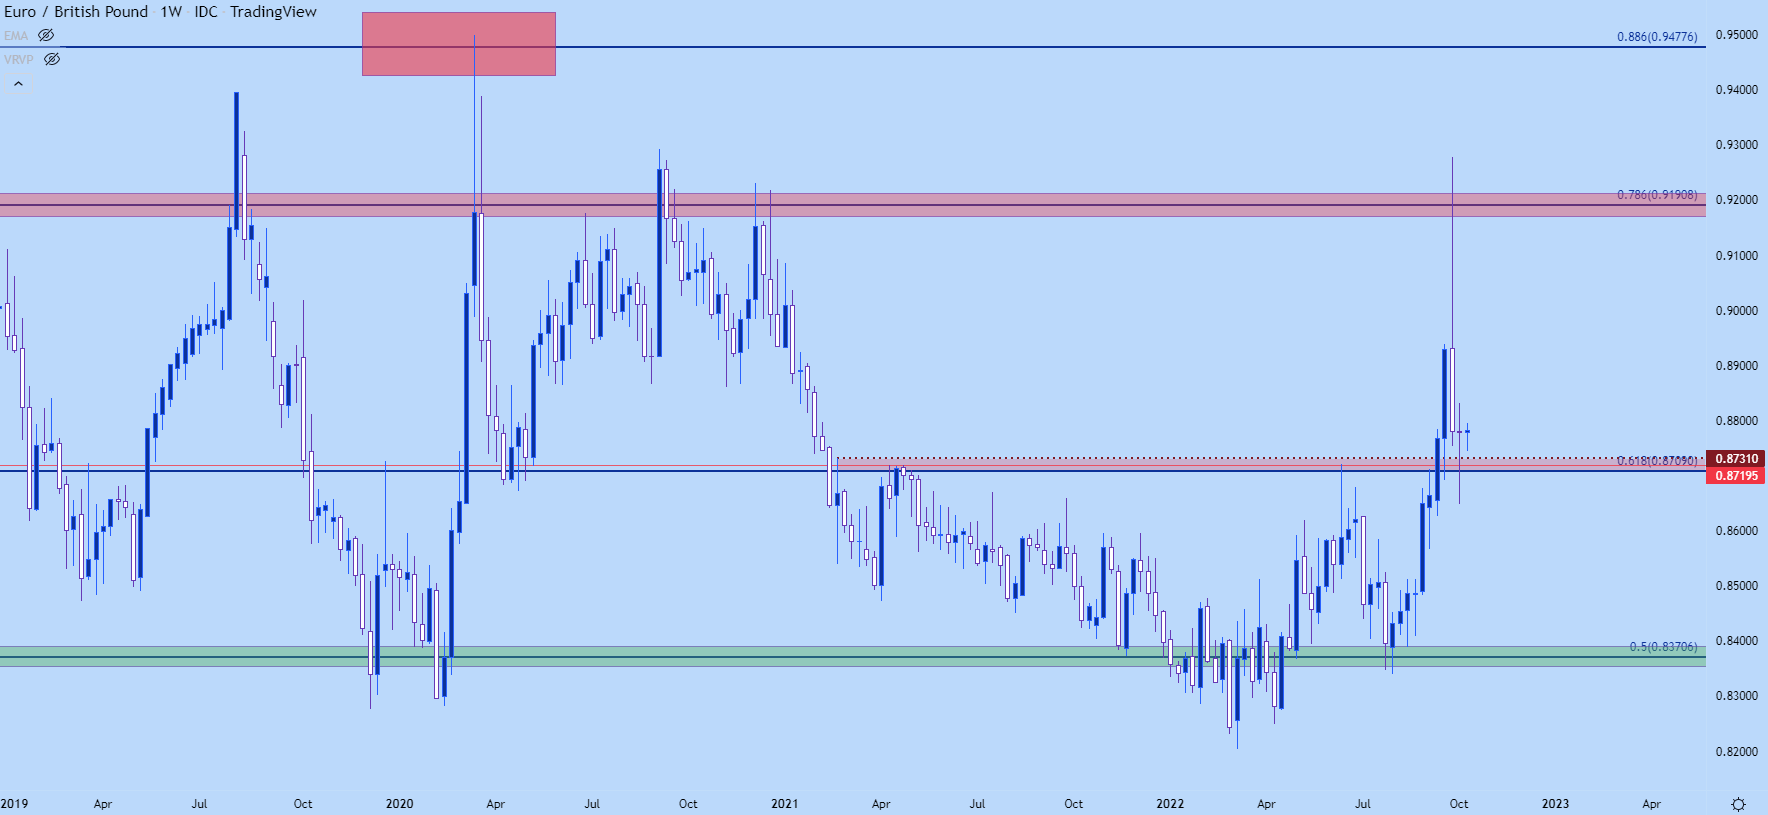
Chart prepared by James Stanley; EURGBP on Tradingview
EUR/GBP Shorter-term
The daily chart highlights more recent price action and for bulls, the level at .8853 is key as this was a prior spot of support. For pullback themes to keep short-term bullish hopes alive, bulls will need to defend above last week’s swing-low around .8650. Preferably for bullish themes, buyers will hold support around the 61.8, plotted from .8720-.8731.
EUR/GBP Daily Chart
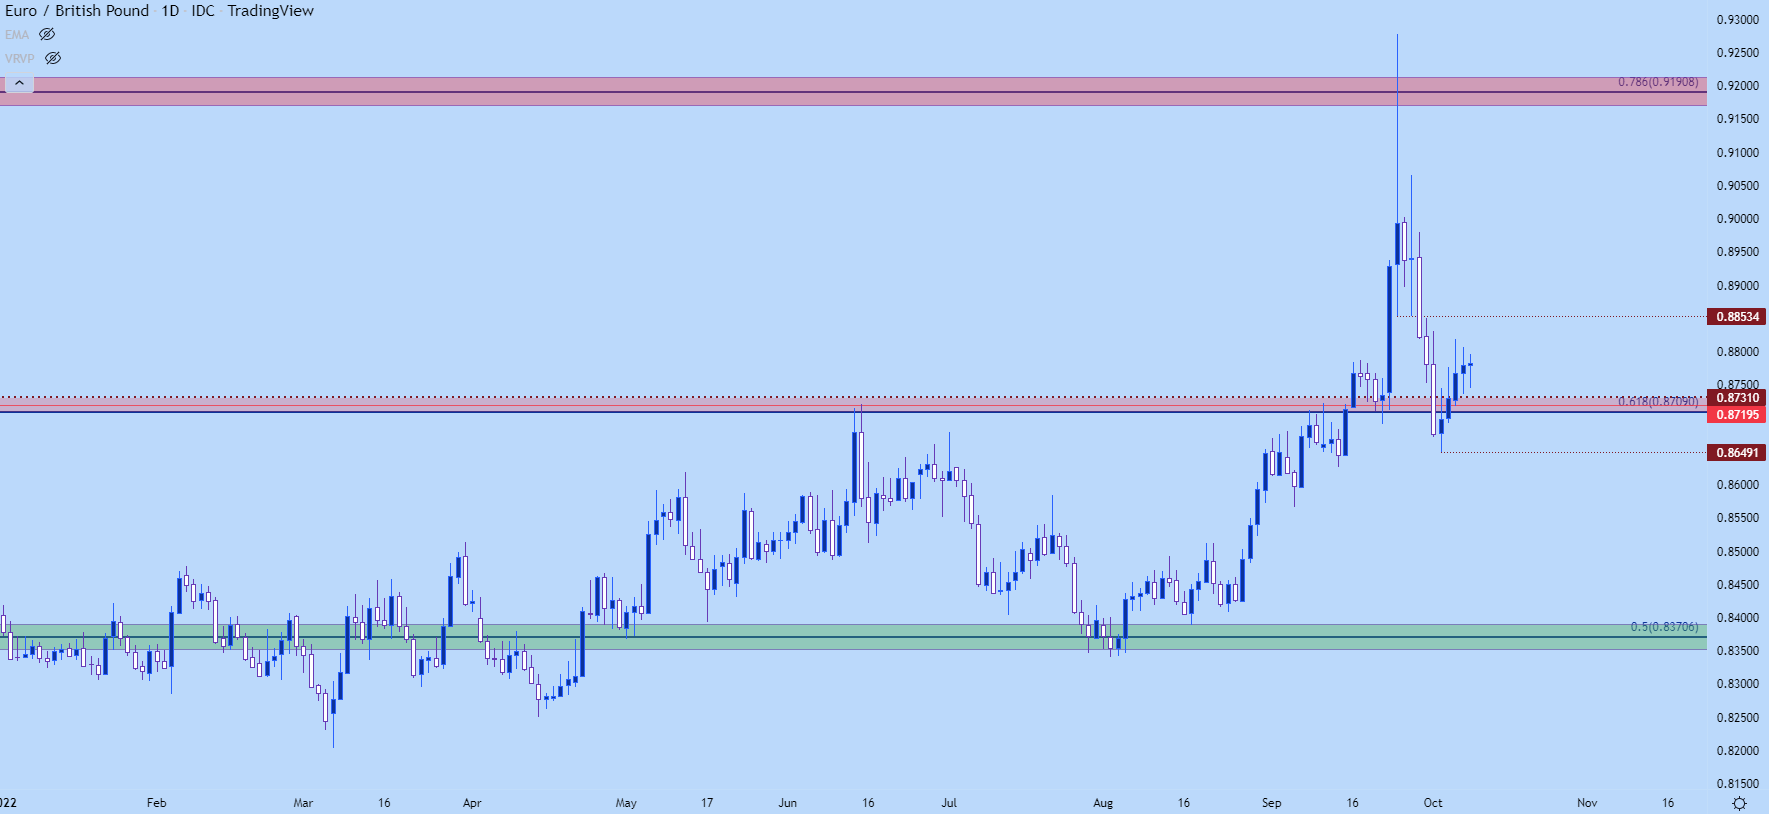
Chart prepared by James Stanley; EURGBP on Tradingview
--- Written by James Stanley, Senior Strategist, DailyFX.com & Head of DailyFX Education
Contact and follow James on Twitter: @JStanleyFX


