


US Dollar Talking Points:
- The US Dollar has dropped by as much as 3.3% from the high that was set last Wednesday and many are asking if the USD has topped.
- Given how aggressively overbought the greenback had become, this retracement looks to be a correction in the trend with no evidence yet of anything larger. However – price is approaching some major supports and performance around those levels will be key for determining near-term strategy.
- Of particular importance is the fact that the US Dollar is a composite of global currencies so the bigger question is when sell-offs in EUR/USD or GBP/USD might return and, in a related item, how will USD/JPY hold up with the pair pegged to the 145 level thought to be the line-in-the-sand for Japan’s Ministry of Finance?
- The analysis contained in article relies on price action and chart formations. To learn more about price action or chart patterns, check out our DailyFX Education section.

Has the US Dollar topped?
I’ve rhetorically asked this question what feels like a dozen times over the past few months. But, not to belabor the point, I think that what we’re seeing right now is a pullback and there’s lacking evidence to suggest that it’s anything more at this point.
Of course, this is the future we’re talking about so things can change. But, the US Dollar just set a fresh 20-year-high not even a week ago. The move was somewhat extreme as a bullish trend heated up very fast and this was driven by the collapse in the British Pound. And given the turn-around that we’ve seen in GBP/USD as shorts have covered, USD has similarly given up much of that move.
There’s another factor driving and this too set a fresh high last Wednesday and has pulled back since, with many already saying that it’s topped, and I’m talking about Treasury Yields.
Yields were surging last week on the back of strong data and a series of hawkish comments from various FOMC speakers. The ten year note hit 4%, something that hadn’t happened since 2008. The two year hit 4.36% which is the highest since October of 2007, and has since pulled back to find support at the 4% marker.
US 10 Year Treasury Yields
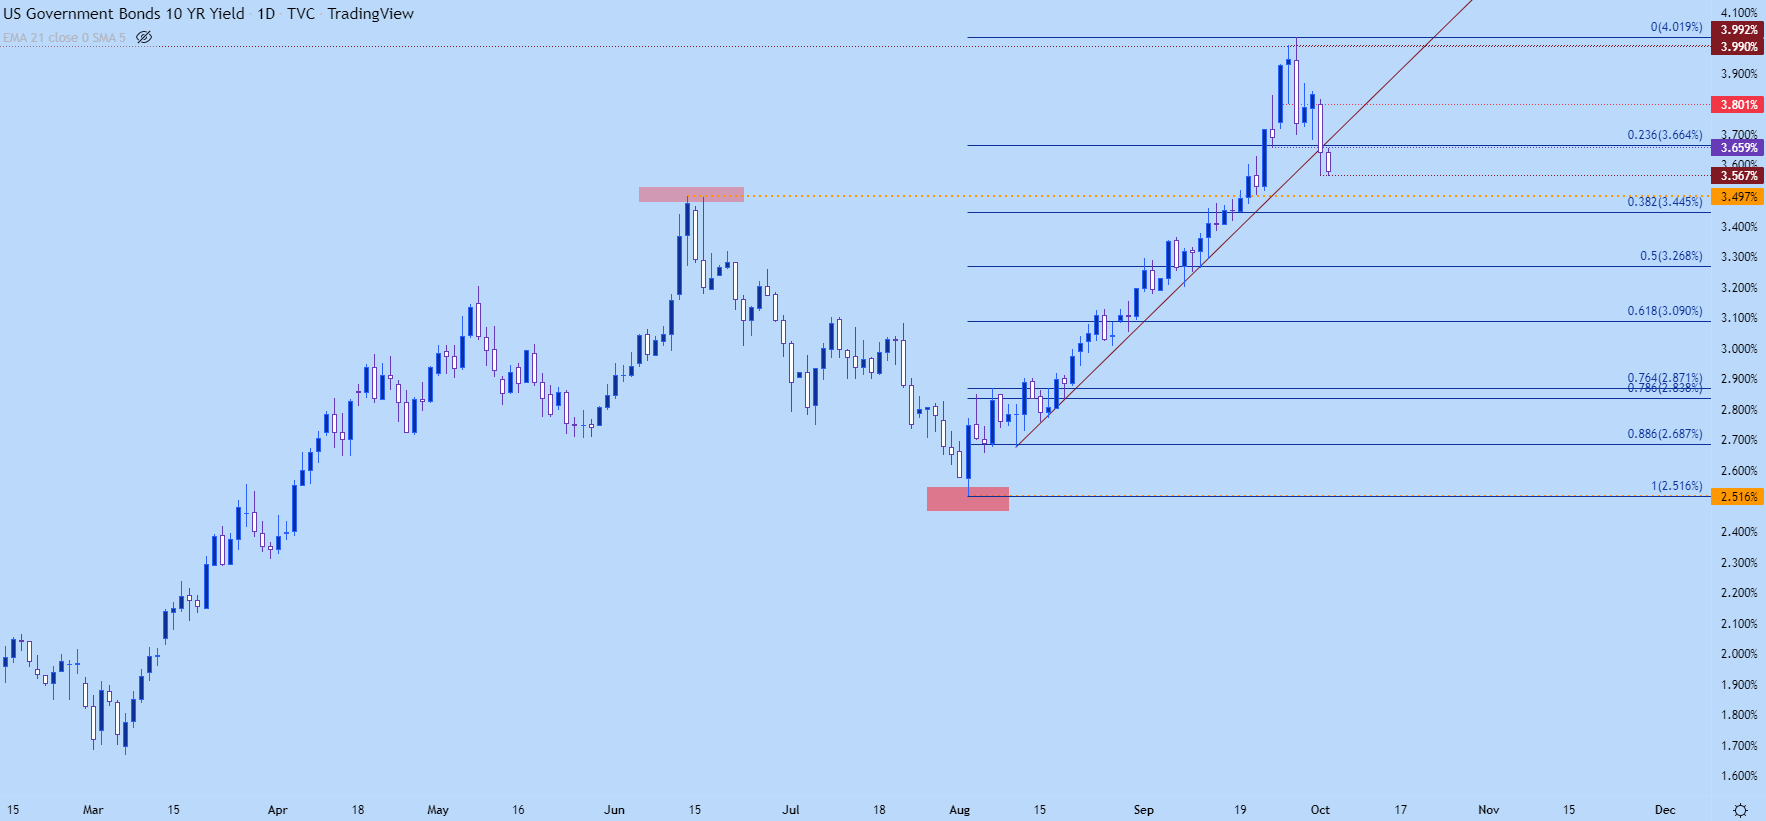
Chart prepared by James Stanley
Dynamics across the Treasury curve can remain as an important piece of the puzzle. Notably – the Fed controls short term rates and normally that feeds into the rest of the curve, with investors adding a premium for the additional time to expiration. This is why yield curves are often sloping up and to the right, to account for the additional premium assigned to the additional risk. But when there’s an element of fear or caution, investors may instead anticipate some element of change in the environment, which would bring on a change in policy and hence, lower rates. So, when investors begin to buy longer-dated treasuries, they’re both capturing the yield at the time (similar to locking in that rate of return if the bond is held to maturity) while also making a bet that rates will be lower at some point in the future. As rates go down, bond prices go up, and the investor in this case would have the option to float a principal gain on the investment while also attaining a rate of return greater than what the market was offering at the time.
All of this is to say – at this point, it appears this move is a pullback in a larger trend on the US Dollar. But, as noted at the very beginning of this article, things can change. So, what might indicate as such in the USD and in-turn, major FX pairs?

US Dollar
The US Dollar was already parabolic before the British Pound melted down to start last week. But, given the 11.9% allocation of GBP in the DXY quote, that plummet in GBP meant a surge in DXY and the USD scaled-up to a fresh 20-year high. Prices came very near the 88.6% Fibonacci retracement of the 2001-2008 major move before turning around, and from the monthly below, we haven’t even really gotten back for a support test at prior resistance.
That prior resistance from the monthly is all the way down at the 110.00 level, after which there’s an area that looks a bit more solid as prior resistance as there were two monthly highs carved out around 108.75.
US Dollar Monthly Chart
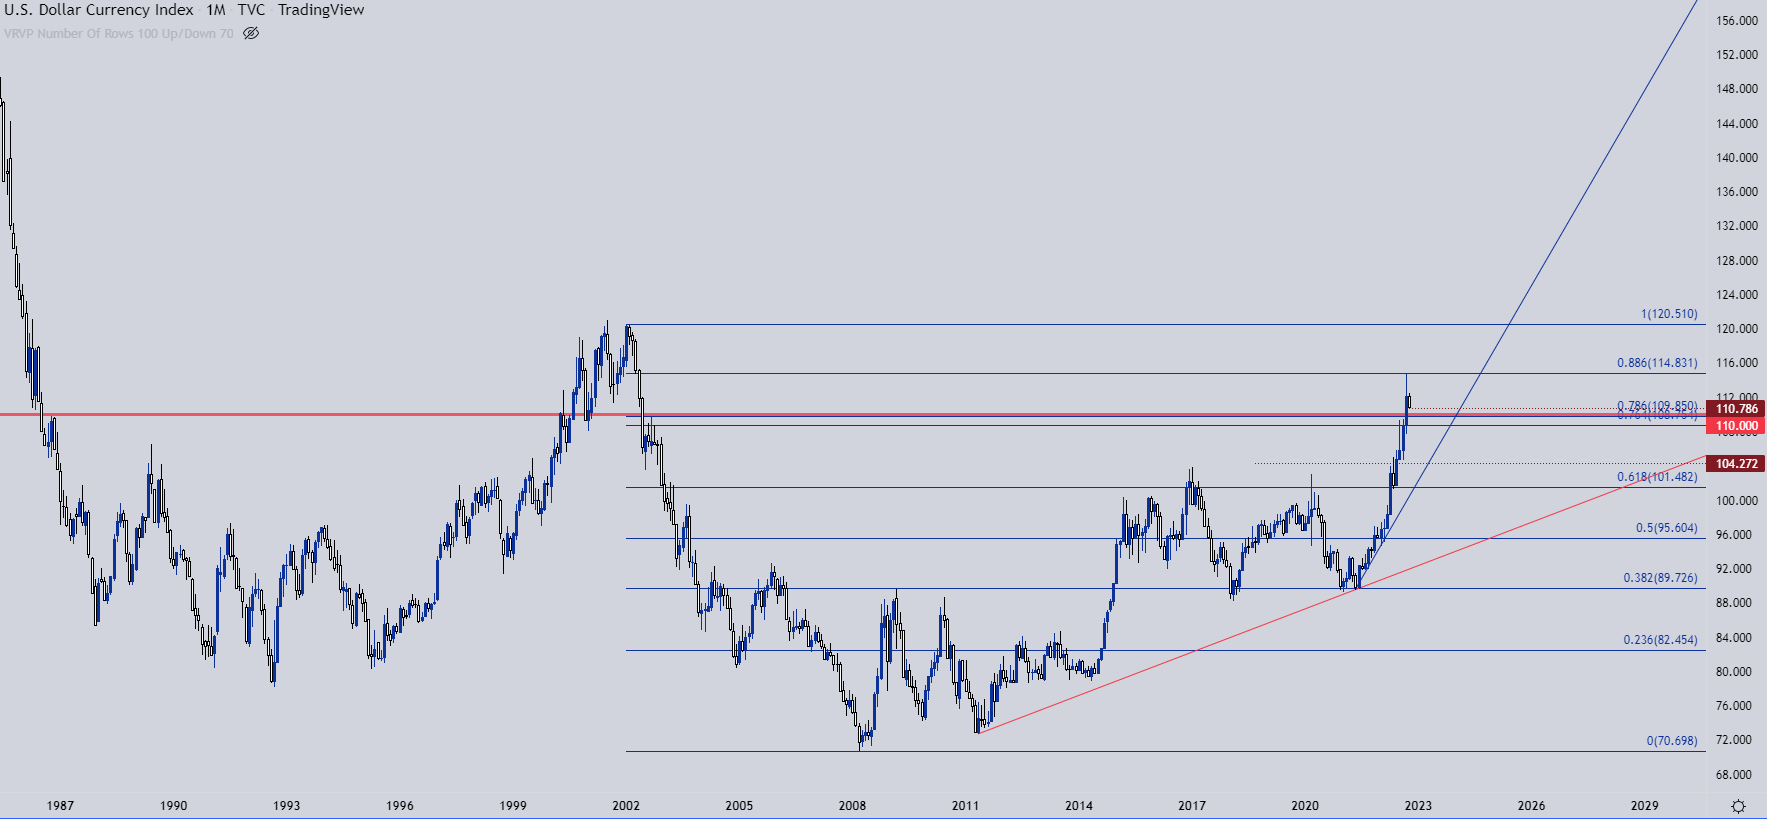
Chart prepared by James Stanley; USD, DXY on Tradingview
USD
Going down to the weekly chart highlights another area of possible support, and this comes from the prior weekly high at 110.79. But, really, it’s that zone around the 109.85 Fibonacci level that’s confluent with the 110.00 handle that grabs attention as this helped to hold the high for three weeks – all the way into the breakdown move in GBP/USD which sent the bullish trend to another degree altogether.
US Dollar Weekly Chart
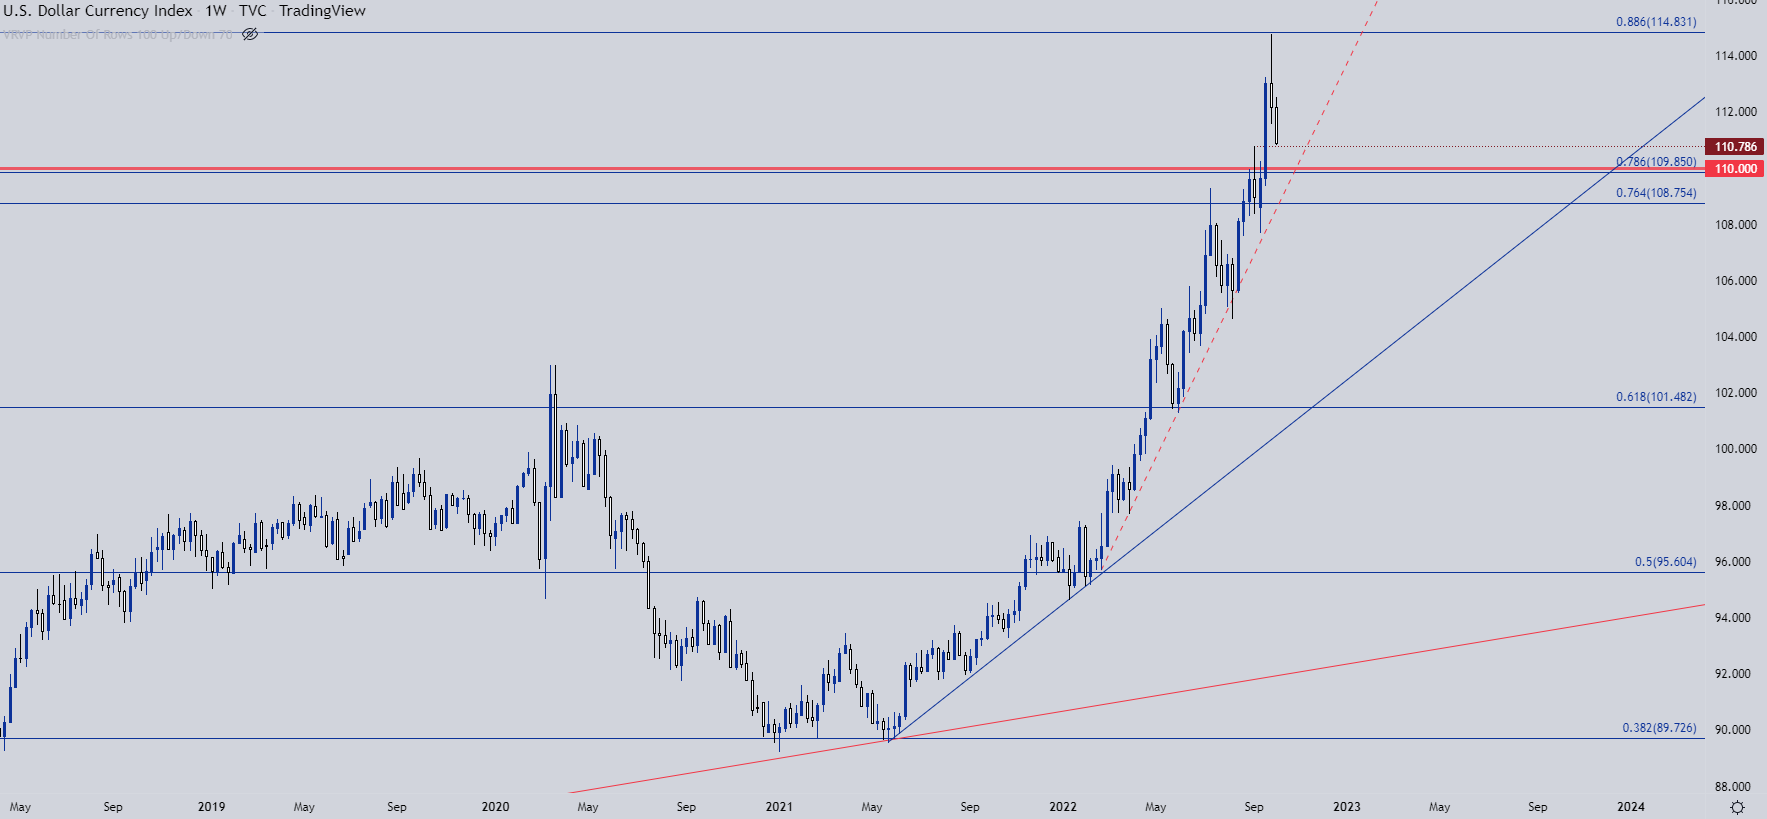
Chart prepared by James Stanley; USD, DXY on Tradingview
USD Daily
From the Daily chart below we can get a better view of near-term dynamics in the USD. The 110.79 prior high is almost in-play and below that, the 109.85-110.00 zone functions as an ‘s2’ area of support. Below that, 108.75 is of note as this helped to set the high in June and then below that, we have a prior double bottom formation around the 107.59 level.
If USD breaks-below that, we also have breach of the bullish trendline which would indicate the potential for a deeper sell-off in the greenback.
US Dollar Daily Chart
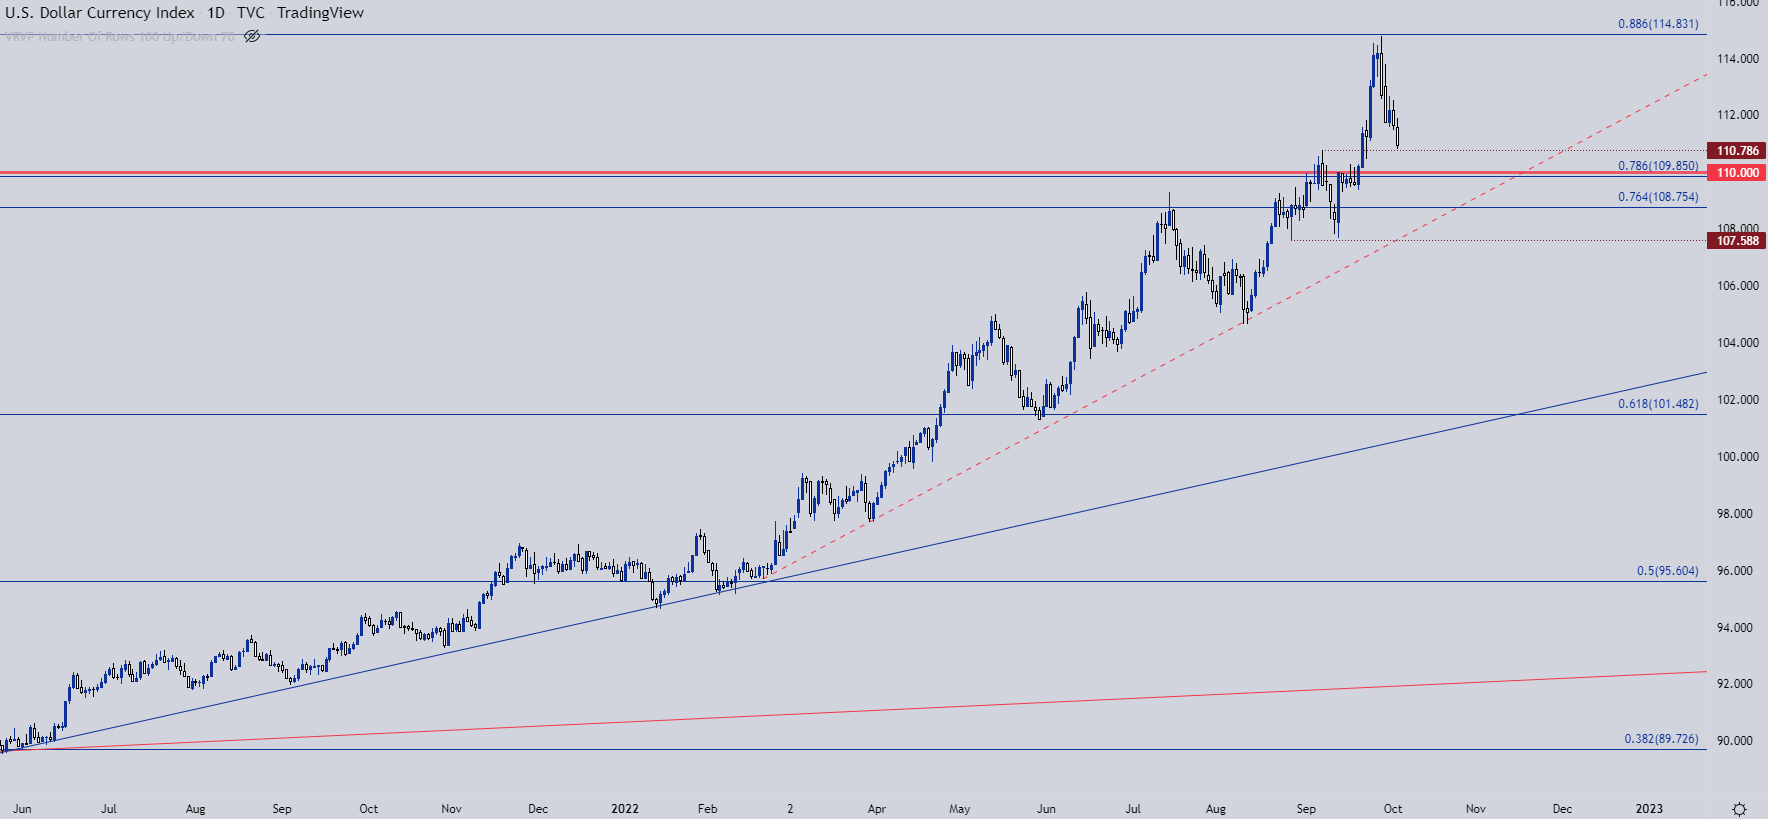
Chart prepared by James Stanley; USD, DXY on Tradingview
Currency Quandary
One important note and now that there are many non-FX traders watching FX markets, it’s an important point to make.
Forex is unique from most other markets. Because currencies are the base of the global financial system – there’s not really another way to measure the value of a currency – than by using other currencies. This is why FX is traded in pairs. Want to know the value of the Euro? Well, against what? Without some yardstick of measurement there’s not really a mechanism to quote value or price, and this is why EUR/USD is often the default answer to that question.
But, taking this a step further, the value of the USD is a composite of underlying currencies. The Euro makes up a large portion of that with a 57.6% allocation. But, also important is the Yen, with a 13.6% weight and the British Pound at 11.9%. The Canadian Dollar is 9.1% of the DXY quote after which the Krona (4.2%) and Swiss Franc (3.6%) make up the rest.
So – that melt up that we just saw in the greenback – was really result of meltdowns elsewhere. Most recently GBP/USD was the obvious culprit. But, to a similar degree with a longer-term scope, that’s been EUR/USD which has pushed below the parity handle. And the Japanese Yen, which is now seeming to be pegged around the 145.00 level after the Japanese intervention a couple weeks ago.
For continued strength in USD – we’re going to need to see continued weakness in EUR/USD and GBP/USD. And perhaps even strength in USD/JPY and USD/CAD. I’ll parse through those below.
EUR/USD
EUR/USD broke down in a troubling way in late-September. Even with the ECB ramping up rate hikes, the currency pair fell through support to set a fresh 19-year-low. Price made a run at the .9500 psychological level but ended up grinding in support at .9950 over a three day period last week, which led to the build of a morning star formation, which is often tracked with the aim of bullish reversals.
That’s continued to run and price is now back in a prior zone of support that runs from the .9900 handle up to parity. The price of .9950 seems especially important as this is what was setting support a couple weeks ago, just as sellers were taking their big swing on EUR/USD ahead of the breakdown.
EUR/USD Daily Chart
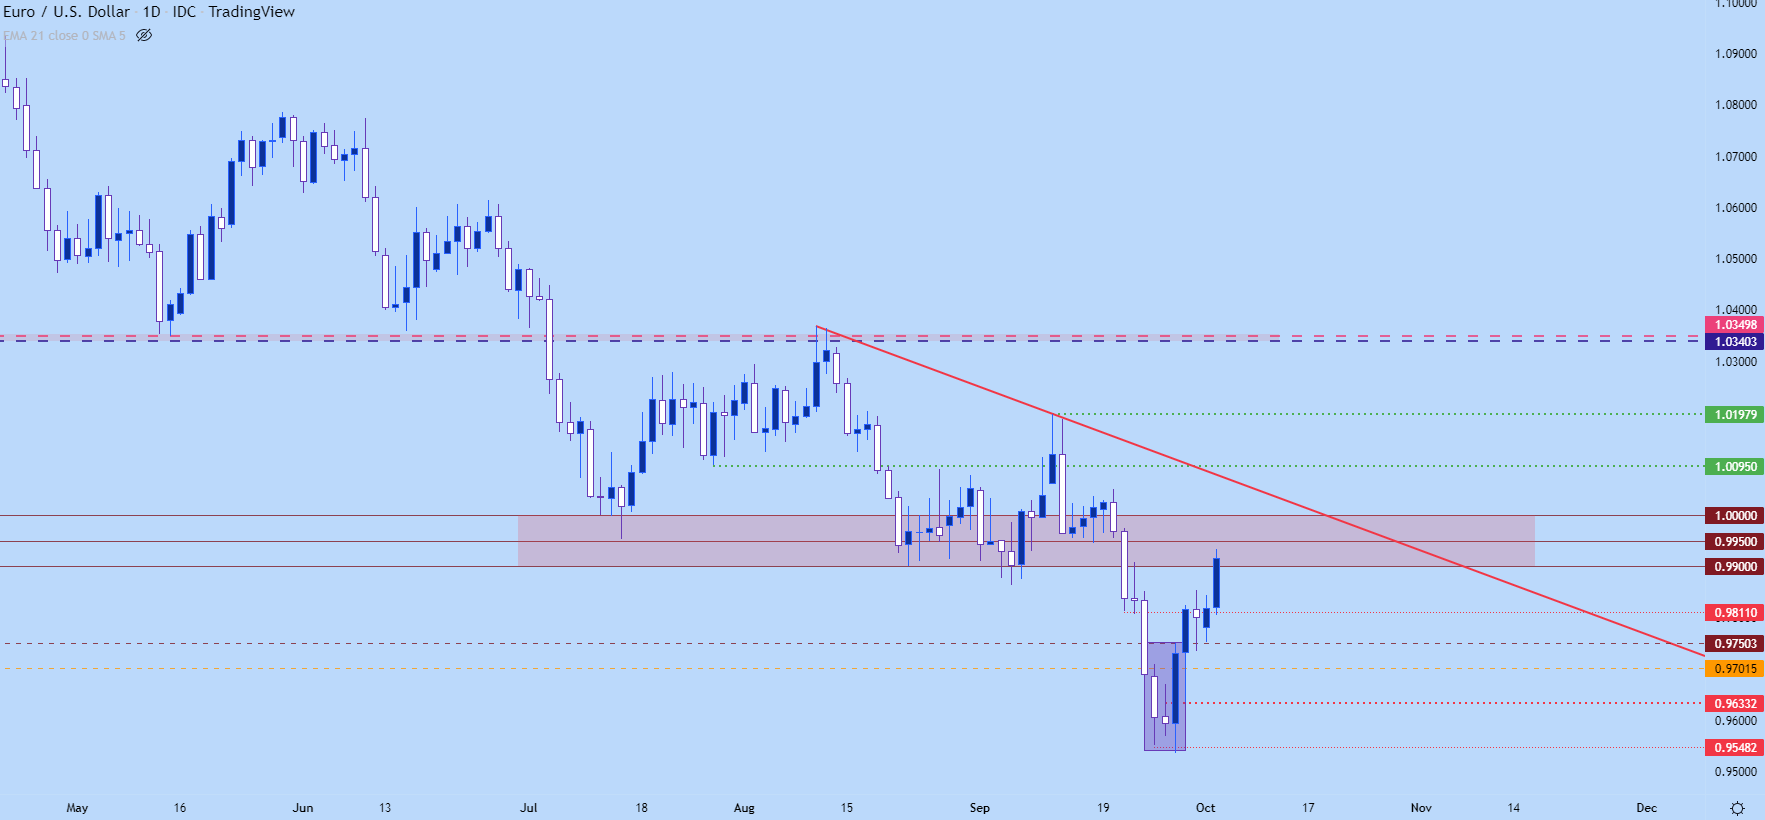
Chart prepared by James Stanley; EURUSD on Tradingview
EUR/USD Shorter-Term
From the four-hour chart we can get a better view of prior price swings, which could come in as helpful in plotting resistance points. Again, .9950 sticks out but parity is also of key importance as this would be the first test above the big figure since the breakdown.
Will there be buyer bullishness on prints above parity? If there are, there’s more resistance potential overhead, taken from the bearish trendline, which currently projects to just inside of the prior swing around 1.0095.

EUR/USD Four-Hour Price Chart
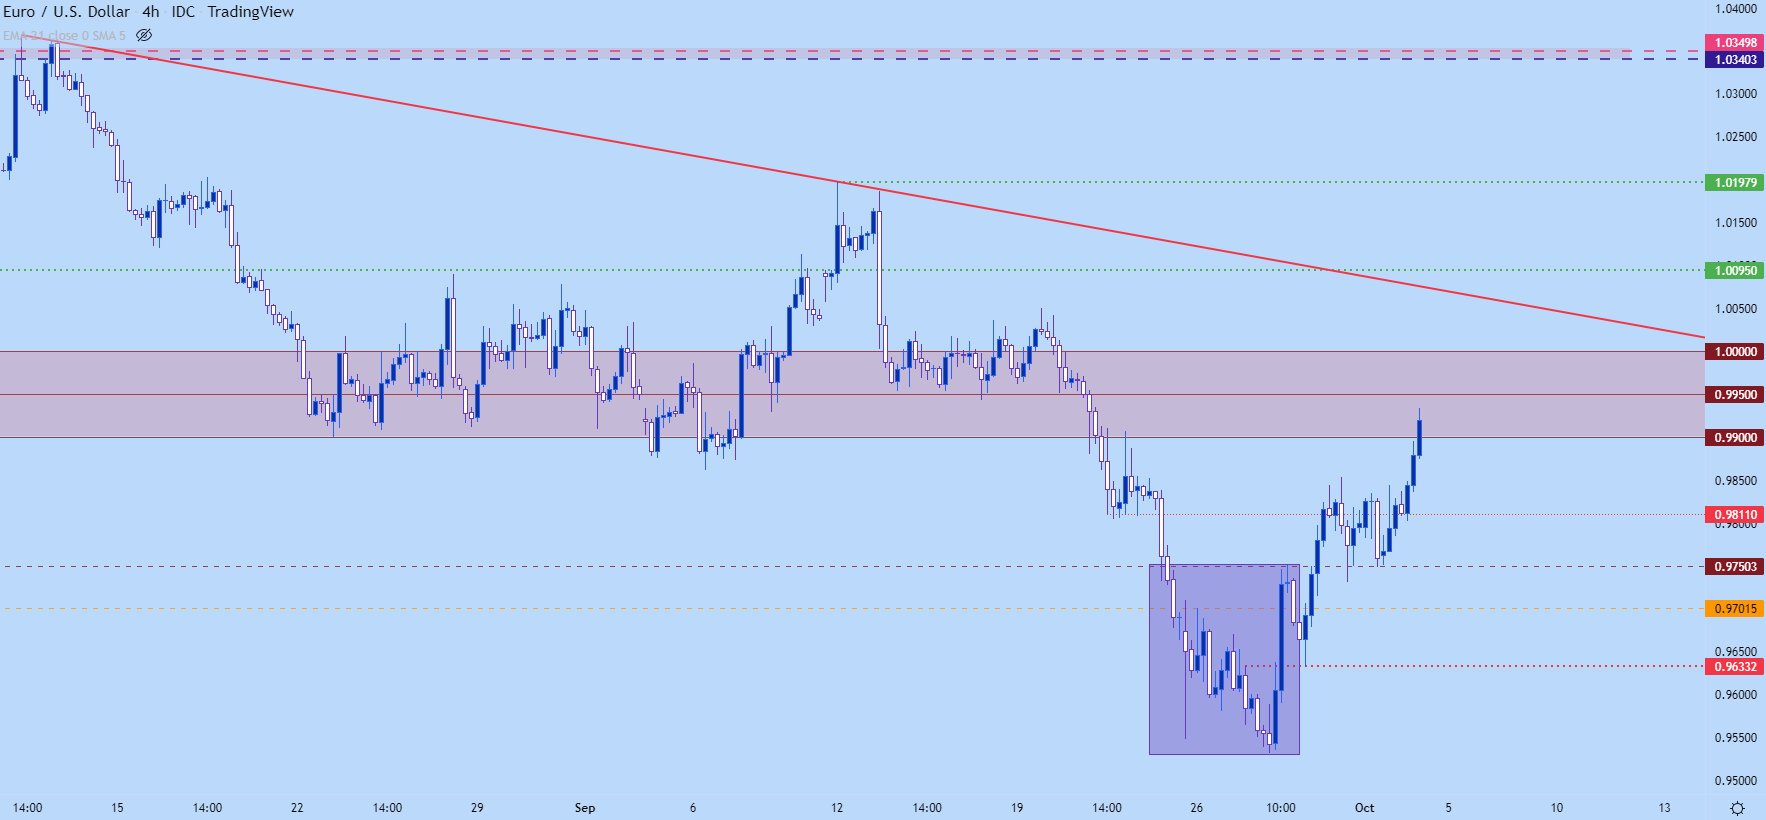
Chart prepared by James Stanley; EURUSD on Tradingview
GBP/USD
The British Pound went into full collapse to start last week. The currency has since clawed back a large portion of those prior losses but, at this point, its difficult to ascertain how much of this jump is short-covering and how much is legitimate buying interest, especially given the opacity of the situation that led to the collapse in the first place.
And while the move in GBP/USD is strong, the move in GBP/JPY has been jaw-dropping after the test of a key long-term support level in the midst of last week’s panic.
Whether this is a bounce or a bottom for GBP is too early to say. I default to charts for such matters, with more trust in price than headlines or feelings, and GBP/USD continues to scale-higher and at this point price is testing through resistance at prior support, from around 1.1350. This puts the focus on the next area of possible resistance, taken from the 1.1460-1.1500 area on the chart.
I’m tracking short-term support around 1.1282 after which another prior support-turned-resistance swing comes into the picture at 1.1210. A break below 1.1210 re-opens the door for a push back to the 1.1019-1.1000 area with the psychological level a major point of interest for that theme.

GBP/USD Two-Hour Price Chart
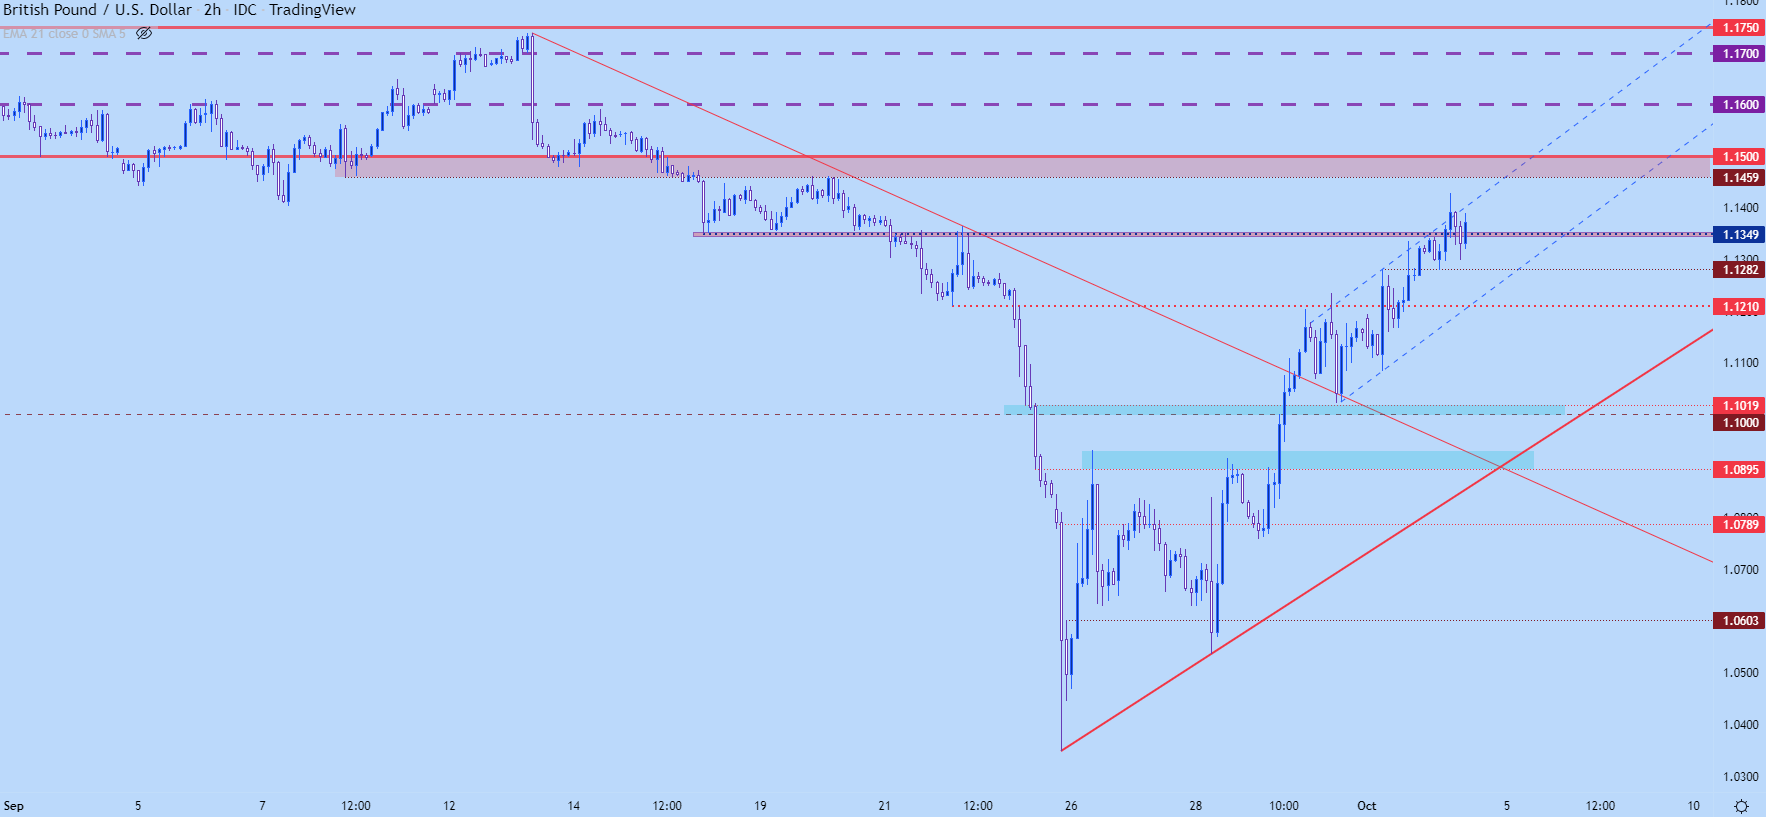
Chart prepared by James Stanley; GBPUSD on Tradingview
USD/CAD
USD/CAD was a pretty illustrative example of the parabolic move in the USD. As rates were flying oil prices were crumbling, helping to add a couple of strong fundamental factors on the long side of the pair, which eventually led to the push up to a fresh two-year-high.
As indication of just how aggressive this trend is – prior resistance is all the way down at the 1.3225 area. The high last week was more than 600 pips away from that, and now we’re seeing some of that move clawed back.
USD/CAD Weekly Chart
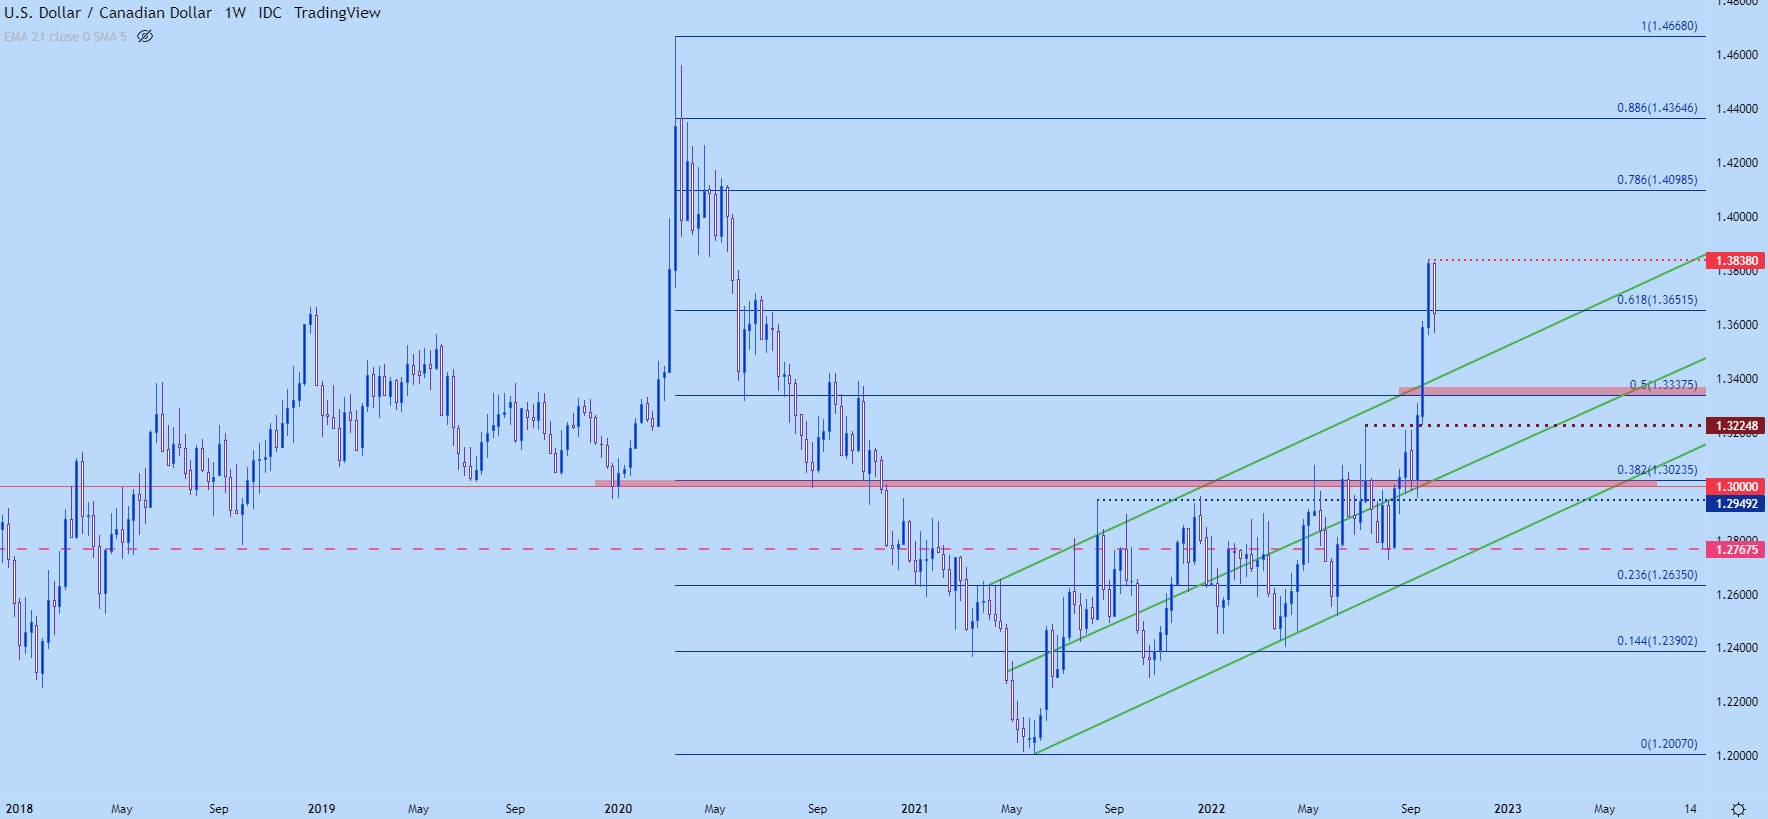
Chart prepared by James Stanley; USDCAD on Tradingview
USD/CAD Shorter-Term
From the four hour chart below, there’s a double top formation given the two prints at the high of 1.3833. The neckline for that formation is at 1.3600 which has already been tested through yesterday, which led to a bounce.
But – if that double top is to fill in, this would project to an approximate move of 233 pips (difference between the top and the neckline) – which would project to a support test around 1.3367, which is just a bit above a key Fibonacci level at 1.3338, which would provide a compelling item of longer-term support for the theme.
USD/CAD Four-Hour Price Chart
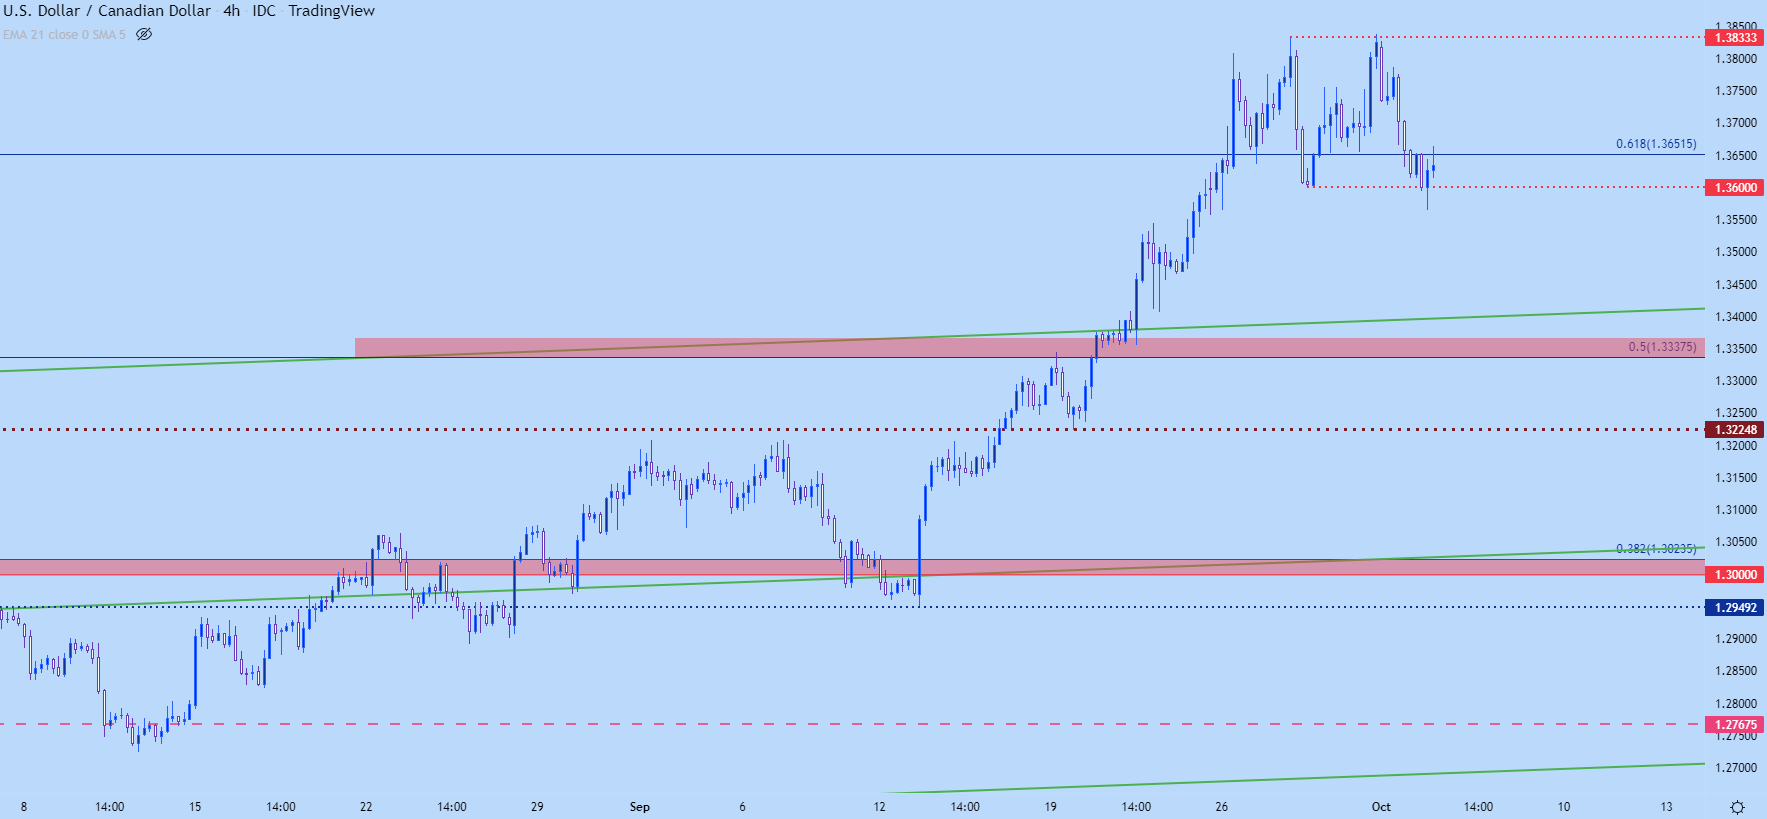
Chart prepared by James Stanley; USDCAD on Tradingview
USD/JPY
This has now become a tough situation…
In my opinion this is now a game of cat and mouse after the Japanese Finance Ministry intervened a couple weeks ago, buying JPY which essentially amounted to a 500 pip pullback that triggered a number of stops and washed out a number of longs.
I talked about this scenario at-length just ahead of the last BoJ meeting, highlighting the 31-year highs in inflation that’s being seen in Japan despite the fact that the BoJ remains loose and passive with negative rates.
The BoJ made no changes – and BoJ Governor Kuroda went so far as to say he wasn’t expecting any changes to forward guidance for years. USD/JPY responded by jumping above 145 and a few hours later, the Finance Ministry asked the BoJ to intervene in the market to reverse the move.
This implies a theoretical line-in-the-sand at 145, which is why price is pegged right there. But – and this is a big factor – longs are still being encouraged by the rate differential, which keeps the carry as positive in USD/JPY, a fact that I pointed out right after the intervention pushed price back to support.
Will the Finance Ministry allow for a breakout beyond 145? Or, will they continue to use finite FX reserves to, in essence, buy down a trade that is being driven by their own monetary policy? It’s hard to say at this point and the techs aren’t very clear in my opinion. But – given what happened two weeks ago – if there is an intervention-fueled sell-off, we’ll likely see even more traders honing in on support to look for price to make a return visit to the 145 area.
USD/JPY Four-Hour Chart
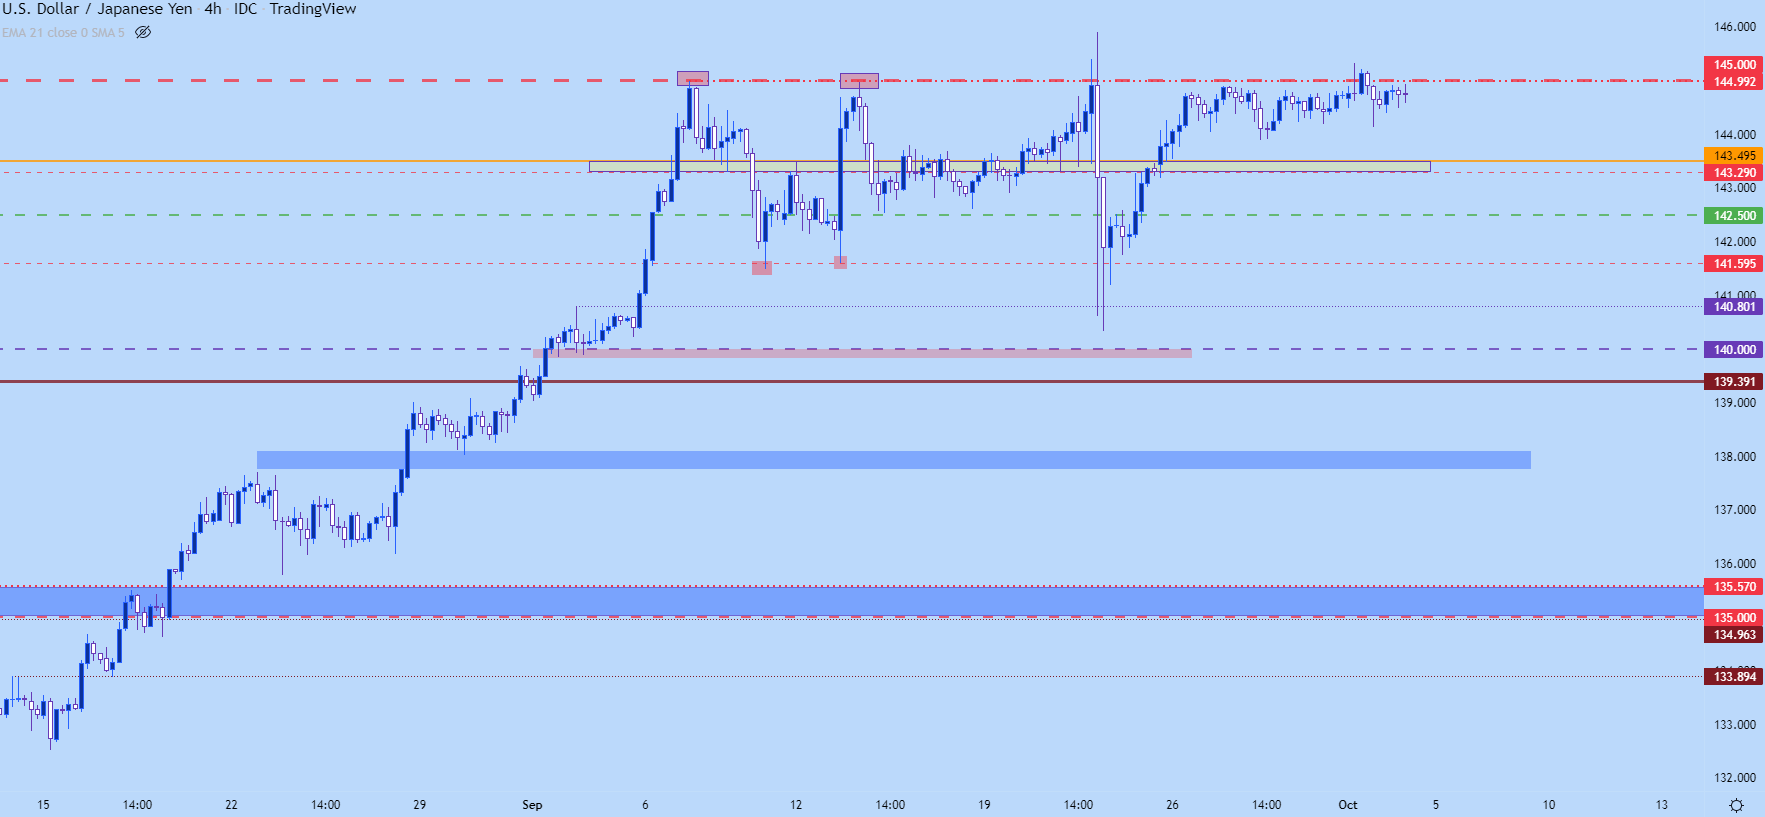
Chart prepared by James Stanley; USDJPY on Tradingview
--- Written by James Stanley, Senior Strategist, DailyFX.com & Head of DailyFX Education
Contact and follow James on Twitter: @JStanleyFX


