


US Dollar Talking Points:
- There’s panic in FX and major currencies like the British Pound are reacting in a troubling manner.
- As I looked at last week there seems to be a disconnect between FX and bonds versus stocks, which are still grasping on to supports, even as panic is getting priced-in to FX and bond markets. One side is likely ‘wrong’ but the question remains as to which.
- The analysis contained in article relies on price action and chart formations. To learn more about price action or chart patterns, check out our DailyFX Education section.

The US Dollar is at another fresh 20-year-high and, at this point, the move is parabolic. This week’s open saw a collapse-like move in the British Pound as Cable pushed down to a fresh all-time-low. There was a bounce pricing-in after the pair set a low at 9PM last night, but much of that bounce has already been erased after the BoE released a statement that didn’t appear to appease market participants.
But, this is just the latest chapter in an ongoing drama that’s seeing the western world’s financial markets come unmoored. That might sound like a grandiose statement if looking at stocks (or ‘stonks’ as the kids used to call them) but if you look at US Treasuries, arguably the most important asset class on Planet Earth, or the FX market which is the underpinning of the world’s economy, it fits.
Just last week the 110.00 psychological level was resistance for the US Dollar. I had looked at that on Monday, showing another ascending triangle that kept the door open for bullish breakouts, and that was with the 110 and 110.25 areas. This morning saw the USD push all the way up to the 114.53 level for that fresh 20-year-high. In between, of course, we had the FOMC rate decision which still seems to be getting priced-in to the equation.
US Dollar Daily Chart
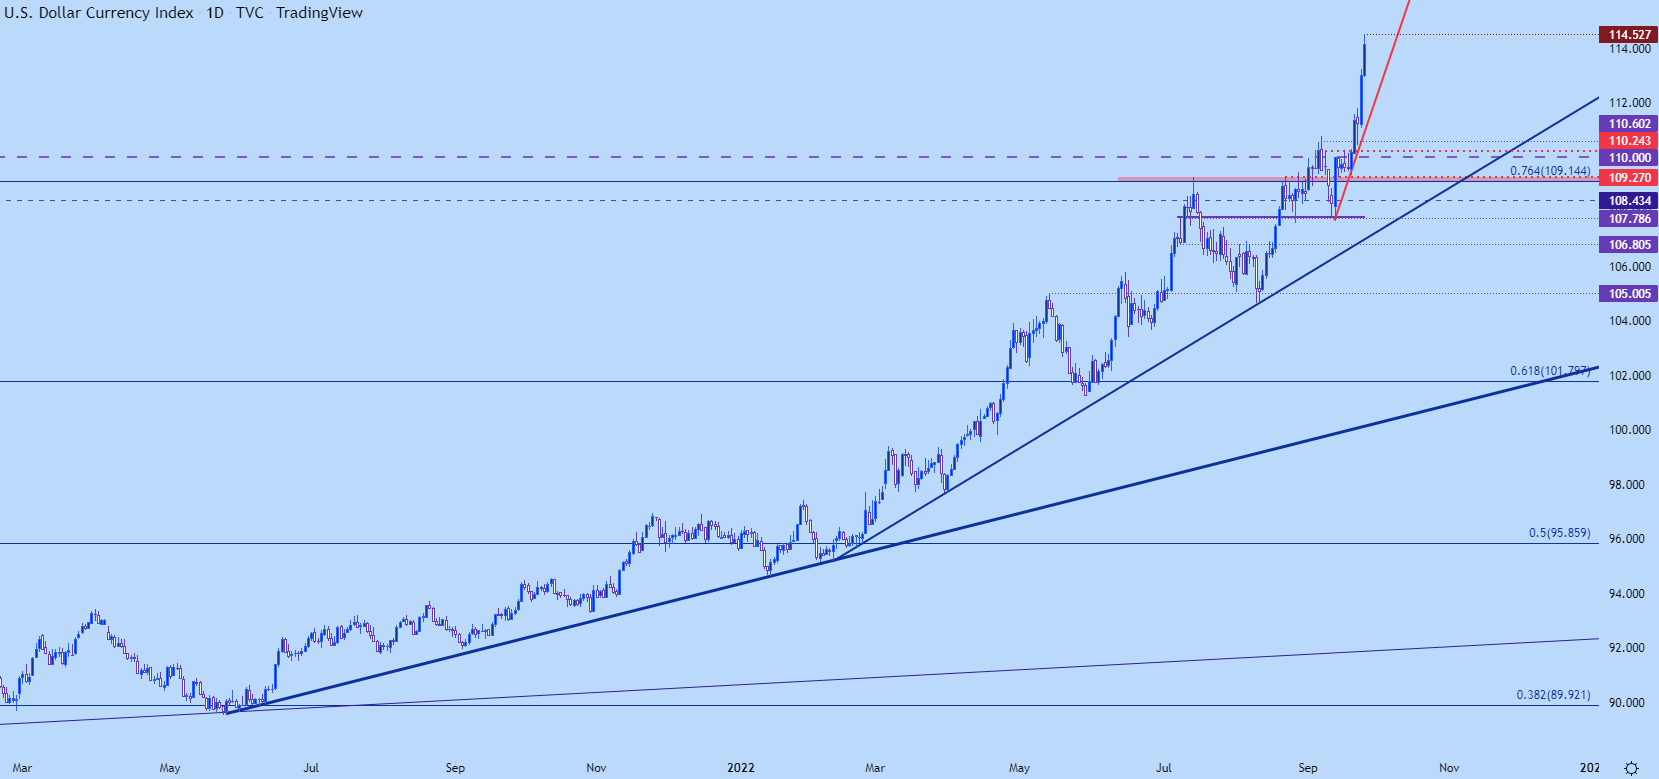
USD: Overbought but, Still Not Stopping
I had talked about this on Friday but in the other direction, regarding oversold conditions on Cable. From the monthly chart we can see just how meaningful this move has been. And we can also see how much of an outlier this type of price action is. Normally – something of this nature would elicit the fades, looking for price to settle as cooler heads prevail.
And that’s somewhat of the problem: Even with this extreme move, buyers have still continued to pile in. This begs the question as to whether we’re on the verge of collapse-like moves elsewhere as, right now, all paths are running through the long side of the US Dollar and bulls are not abating.
US Dollar Monthly Price Chart
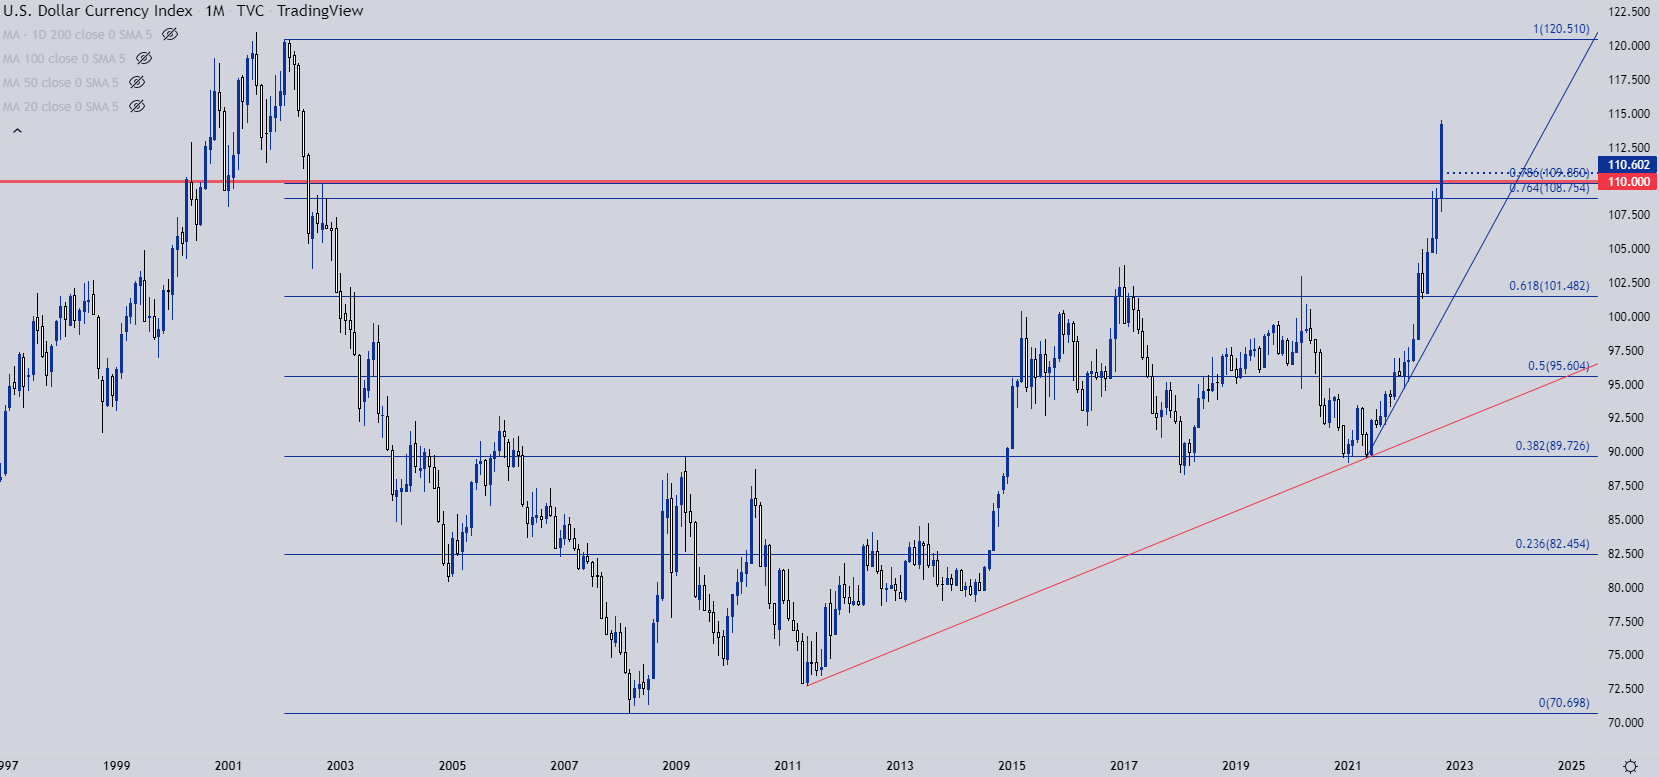
Chart prepared by James Stanley; USD, DXY on Tradingview
EUR/USD
Last week was very bad for the Euro. EUR/USD came into the week grasping on to higher-low support, right around the .9950 area but after a very bad show on Tuesday, longer-term support started to look vulnerable in the pair. I looked into that just ahead of the Fed on Wednesday and after that rate announcement, EUR/USD began to spiral-lower, setting a fresh 19-year-low.
At this point, EUR/USD is trying to hold support from a level that I looked at on Friday, plotted around .9594 which was a swing-high turned swing-low from back in 2002.
EUR/USD Monthly Chart
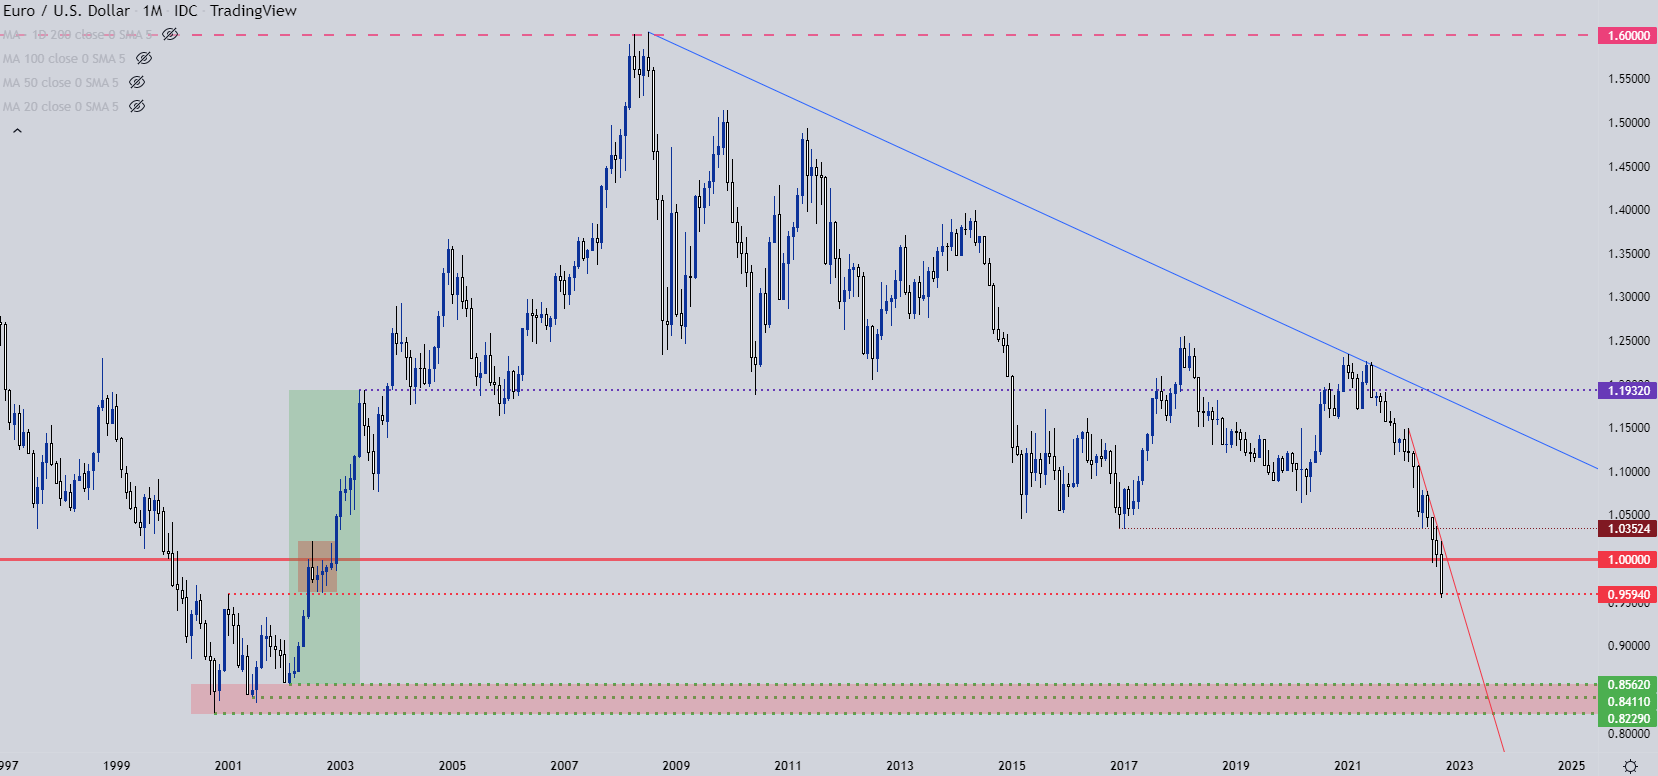
Chart prepared by James Stanley; EURUSD on Tradingview
That price was tested through as GBP was getting hit after this week’s open and similarly, prices bounced in EUR/USD after the low was set at 9PM ET. But, also like GBP/USD, sellers have returned and are threatening another bearish leg to this move.
The recovery has since run-in to a series of lower-highs and this exposes bearish breakdown potential towards the .9550 level that’s currently marking the 19-year-low. And if that can get tested through, the .9500 big figure is just below. If sellers fail to continue the move, resistance can be sought out around the .9700 psychological level.
EUR/USD 30-Minute Chart
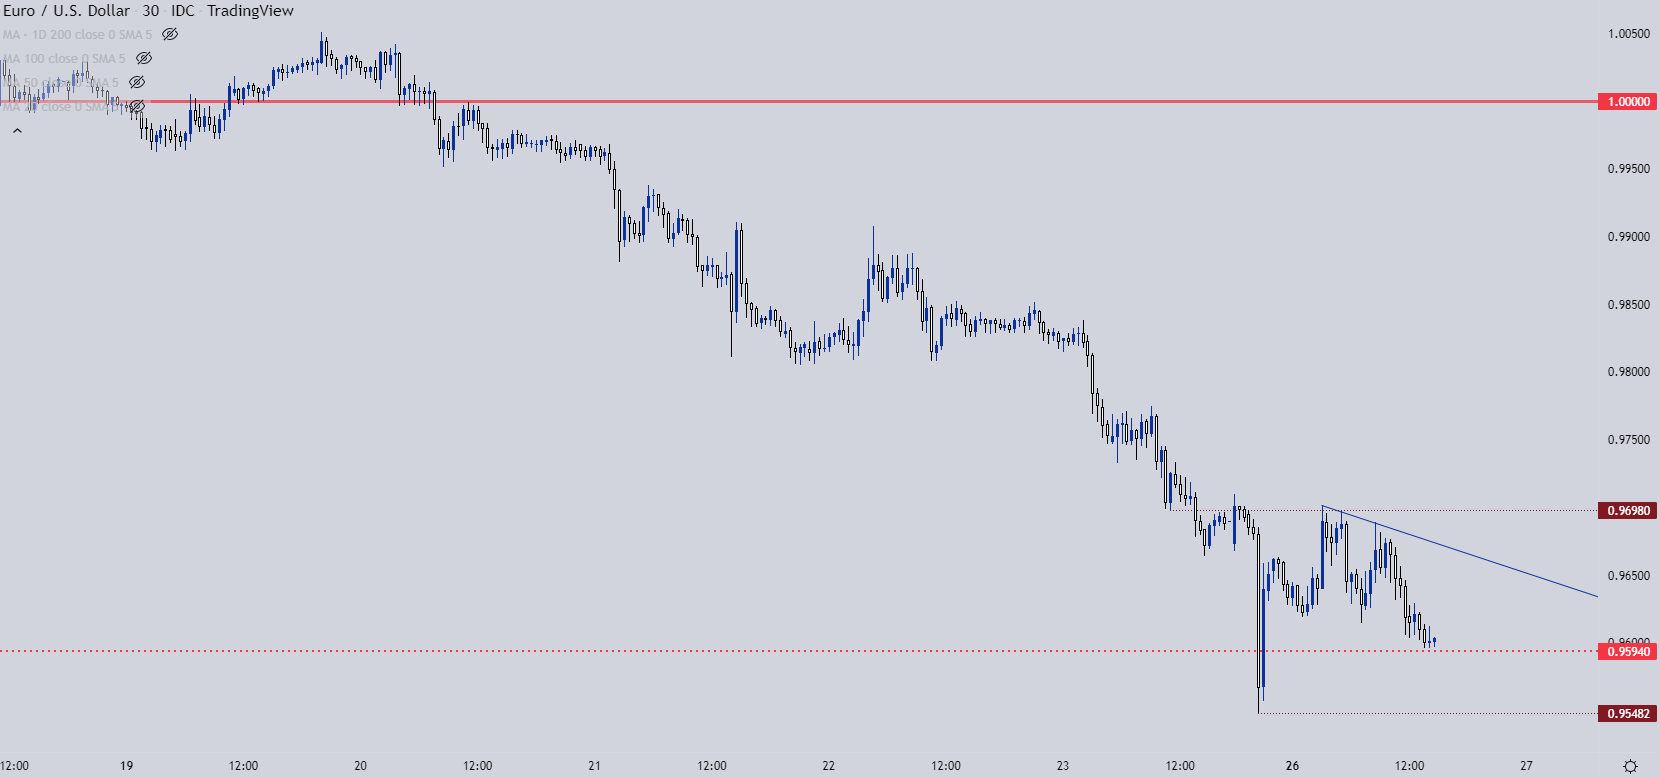
Chart prepared by James Stanley; EURUSD on Tradingview
GBP/USD
Just last week, GBP/USD was grinding support at the prior low from March of 2020 around the 1.1414 level. The pair has completely unraveled since then, with sellers making a mark by pushing prices more than 1,000 pips off of that prior spot.
Today’s daily bar constitutes more than 5% of the GBP/USD quote and there’s a 535 pip daily range, as of this writing. The underside wick combined with the reaction at the prior all-time-low just above the 1.0500 handle is normally something that I’d be investigating reversal strategies around, especially if it’s matched with some type of change or adaptation from the central bank.
And it looked like there might be the makings of such this morning. And then the Bank of England put out a statement that was essentially a non-statement, avoiding commitment to anything other than their next rate decision that’s almost two months away. And GBP/USD went right back in the tank, and now there’s a chorus of calls for a parity print in GBP/USD.
So, from a directional perspective this seems to be a pretty tough time to line up a trend. The big question is if recovery can play-in or whether we see further collapse-like price action similar to what showed at the open last night. But, even then I’m somewhat cautious given timing. 8PM ET, when the break really started to show, is 1 AM in London, when liquidity is generally pretty low. This, to me, sounds like someone is trying to be George Soros 2.0.
For bearish moves, a push below 1.0600 darkens the sky but its breaking back below 1.0500 that’ll re-open the door for a run at the lows around 1.0350.
GBP/USD Hourly Chart
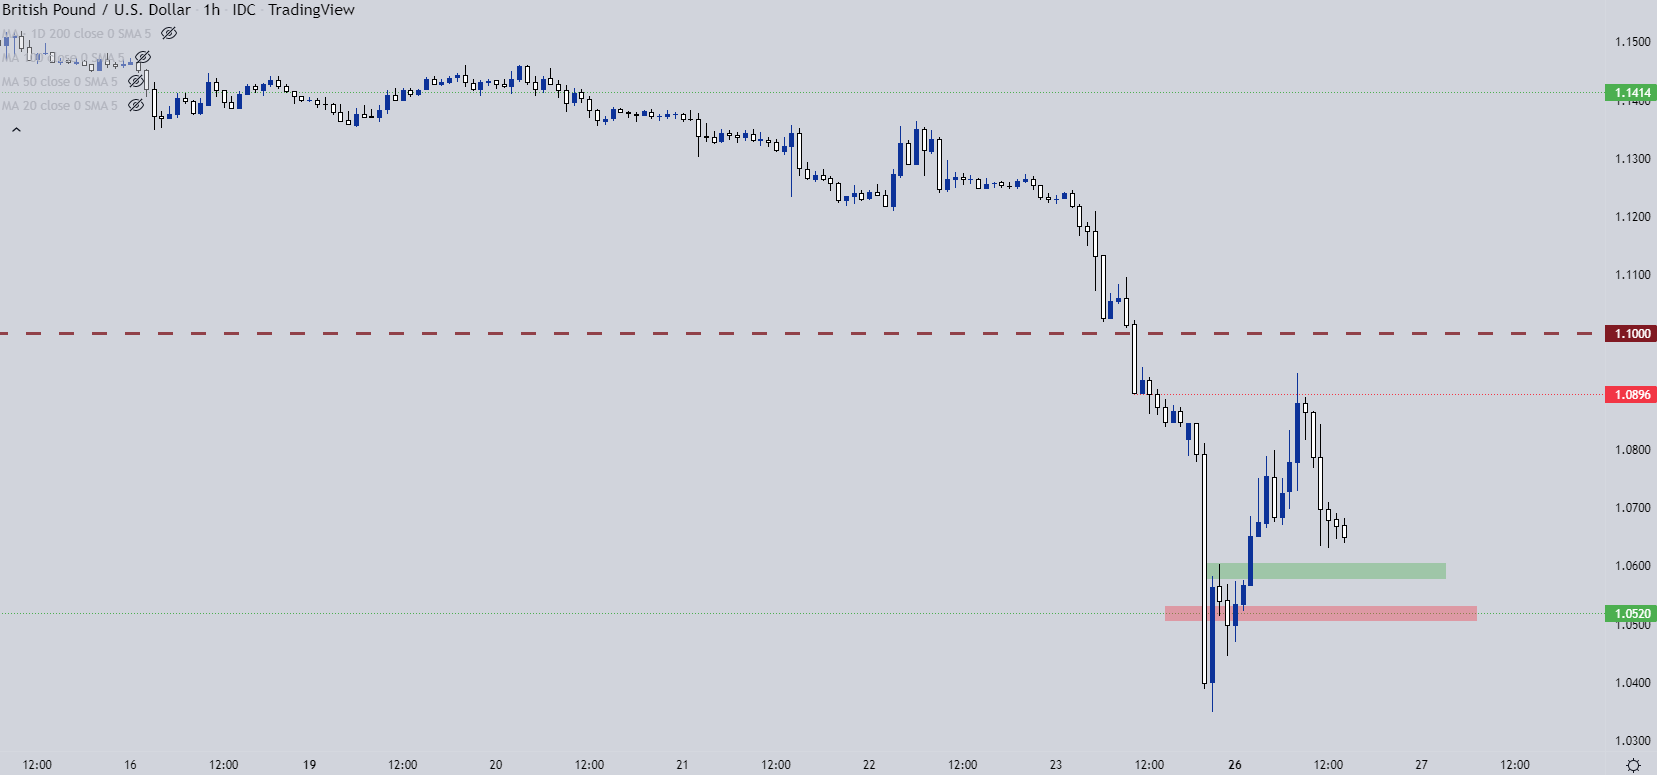
Chart prepared by James Stanley; GBPUSD on Tradingview
USD/CAD
I had covered the Canadian Dollar in our tech forecast this week, retaining a bearish read for the currency as last week saw a major breakout in USD/CAD.
And, it was just two weeks ago when there was some remaining bearish potential as price remained below the 50% mark on the Fibonacci retracement spanning the 2020-2021 major move. There was also a bullish channel, which I was tracking as a bear flag, and that was all nullified last week.
There’s been two major factors at work here, one of which is obvious with the obtuse strength of the USD doing a lot of the pushing. But, falling oil prices are also playing a factor and that’s led to a major breakout in USD/CAD.
At this point, anything on the long side will feel like chasing the move. So, there’s really a couple of possible ways to approach the matter: Either using breakout logic on prints of fresh highs or, alternatively, trying to be patient and wait for a pullback.
Now, if we remain in that panic prone market environment, the breakout will likely remain as attractive. But, if we see the world pull back from the ledge a bit, that’s where higher-low support can become attractive in USD/CAD. There’s a couple of possible spots for such, like the 1.3652 Fibonacci level or, longer-term, the 1.3338 area or perhaps even the prior resistance swing, plotted around 1.3225.
USD/CAD Weekly Chart
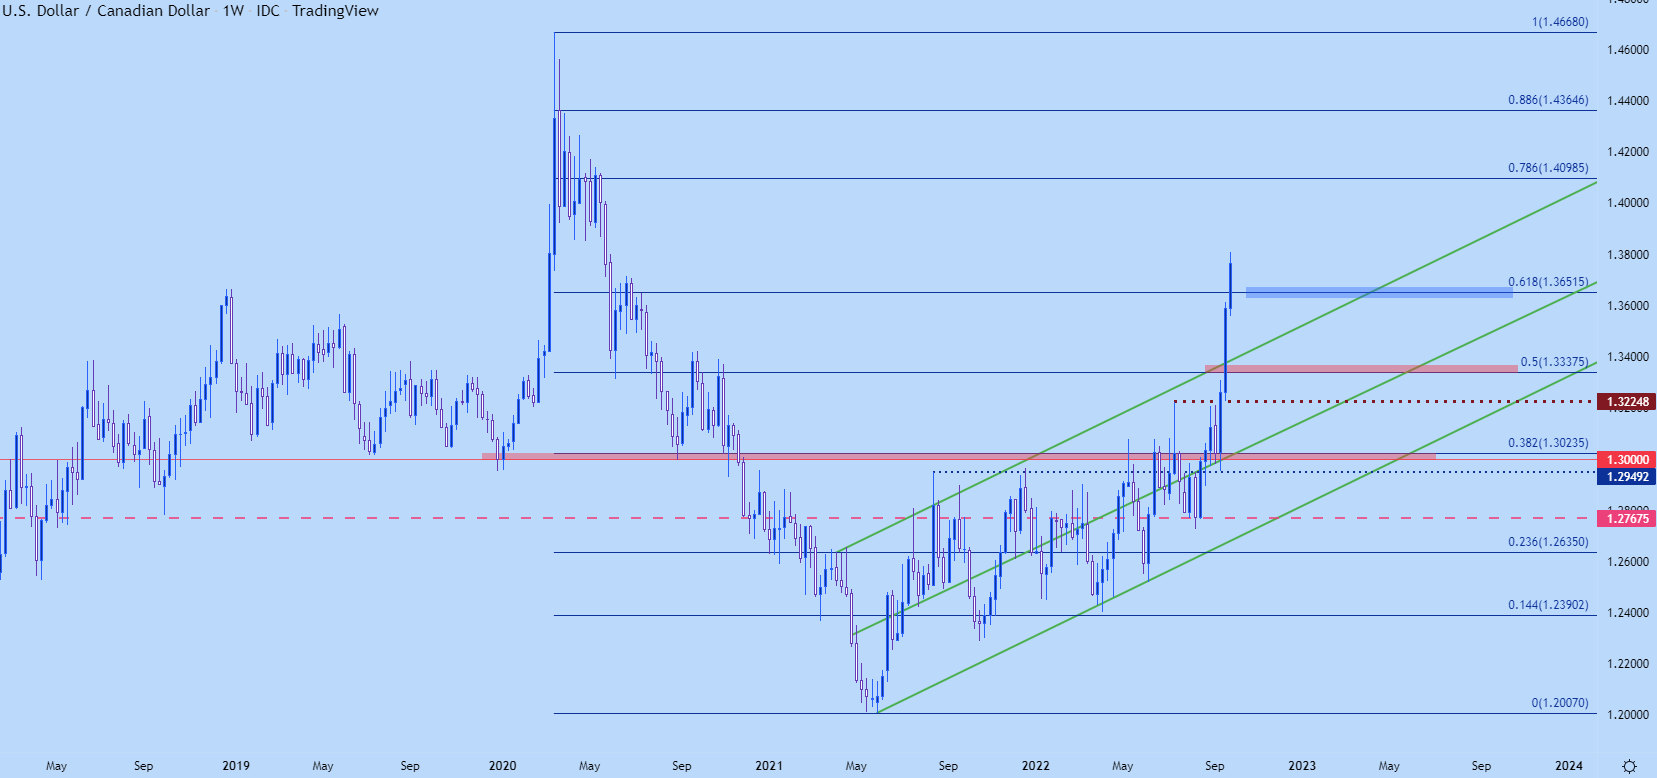
Chart prepared by James Stanley; USDJPY on Tradingview
USD/JPY: It’s Cat and Mouse Now
The Bank of Japan intervened last week on order of the Japanese Ministry of Finance. Perhaps shockingly, this happened shortly after a BoJ rate decision where Kuroda told us not to expect any changes to forward guidance for two to three years.
USD/JPY celebrated that announcement by jumping above the 145 level for the first time in 24 years. But that didn’t last for long as it was right around the Euro open on Thursday morning that the Finance Ministry ordered the BoJ to perform an intervention in the FX market.
The BoJ used FX reserves to sell the US Dollar and buy the Japanese Yen. This pushed USD/JPY down towards the 140.00 handle, albeit briefly. And bulls have been clawing back the move ever since, with prices now very close to that same 145.00 level that was in-play last week.
USD/JPY Four-Hour Chart
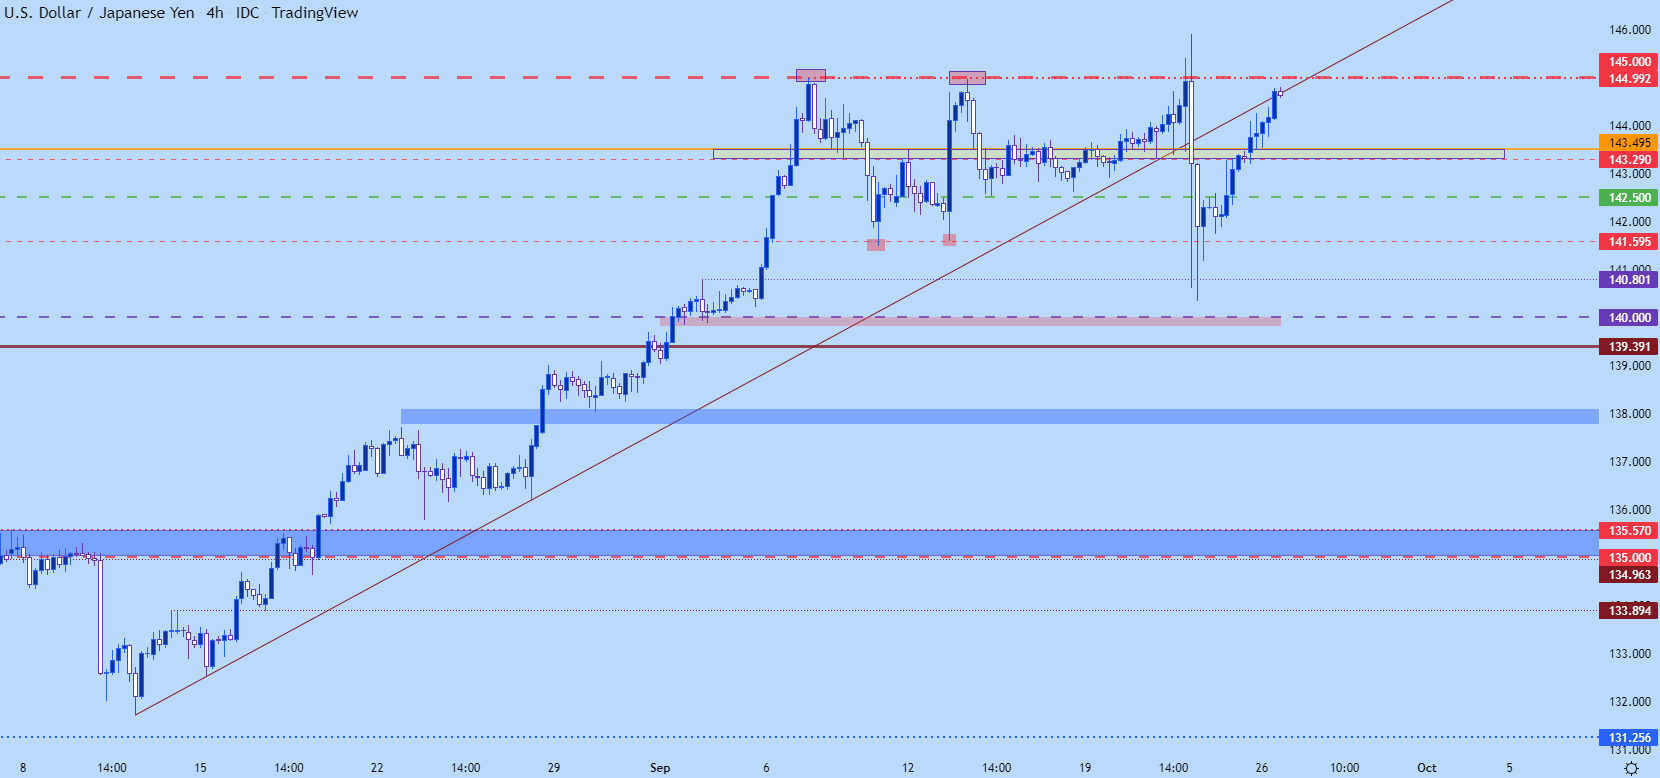
Chart prepared by James Stanley; USDJPY on Tradingview
USD/JPY: Force v/s Nature
At this point the carry for USD/JPY is still positive. So, there’s incentive for traders to investigate and be on the long side of such matters. And as the BoJ keeps rates low and in negative territory and as the US continues to hike, that incentive only grows.
That intervention that we saw last week has already been largely faded-out of the market. So the FX reserves that Japan threw at the problem are essentially being burned and the net impact is that FX traders got entries at lower prices.
To fix the problem, it seems Japan would need to adjust rates, but that brings on a host of additional risks considering the six years of extreme accommodation that has become Japanese Monetary Policy.
The big question now is how aggressively markets want to test this theory and in-turn Japanese policy makers. Prices are already near the 145.00 handle which seemed to be the line-in-the-sand for the Ministry of Finance last week.
Historically speaking, this remains a relevant area as Japan had done a number of interventions in 1998 and USD/JPY is in the 145.00 area at the time.
USD/JPY Monthly Price Chart
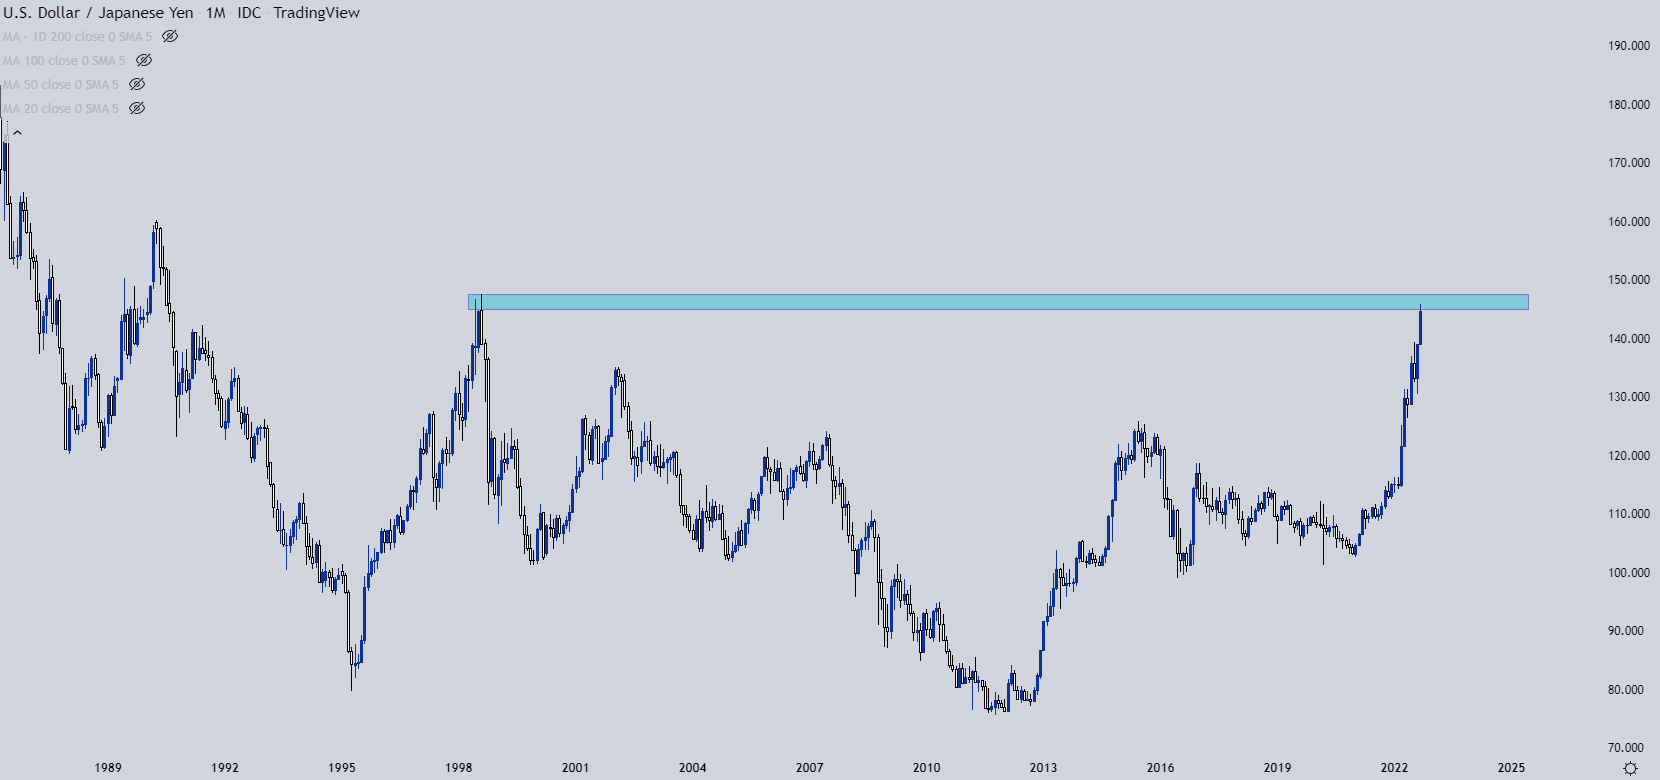
Chart prepared by James Stanley; USDJPY on Tradingview
--- Written by James Stanley, Senior Strategist, DailyFX.com & Head of DailyFX Education
Contact and follow James on Twitter: @JStanleyFX


