


US Dollar Price Action Setups
- This is an archived webinar, looking at price action setups around the US Dollar.
- The rest of this week brings a number of high-impact economic releases out of the US.
- The Q4 open is now just around-the-corner, set to begin on Thursday.
- The analysis contained in article relies on price action and chart formations. To learn more about price action or chart patterns, check out our DailyFX Education section.
Tomorrow marks the final day of Q3 and the day after brings a couple of high-impact US data prints with another couple due for Friday. This sets up for a pretty pensive end to the week and that’s not to mention the Presidential Debates that kick off tonight. In this webinar I looked at the US Dollar and a number of related markets. Towards the end, I also took a look at three US equity indices along with Gold prices.
If you’d like to join this webinar in real-time next week, the below link will allow you to register.
US Dollar Strength Pulls Back
The first two months of Q3 saw a continuation of USD weakness, all the way into the September open. At that point, a big area of long-term support came into play and that’s since helped to hold the lows. And with a little over one full day left in September and Q3, the monthly chart of the US Dollar is threatening to close as a bullish engulfing candlestick – which is often approached with the aim of bullish continuation. For this to remain the case, DXY would need to finish tomorrow’s trade above the August open of 93.46.
US Dollar Monthly Price Chart

Chart prepared by James Stanley; USD, DXY on Tradingview
For shorter-term analysis, I had discussed this matter in-depth earlier today and much of this still applies. This can be seen in the article entitled, US Dollar Price Forecast: USD Pulls Back as US Data Releases Begin.

EUR/USD Jumps Up to Resistance Test
Coming into this week, I was looking for a pullback in EUR/USD to potentially re-open the door to bearish operations. I had outlined that context in last week’s Analyst Pick, looking for potential resistance around an area of prior support, plotted around the 1.1750 psychological level.
That resistance is now in-play and this can keep the door open for short-side scenarios in the pair.
EUR/USD Eight-Hour Price Chart

Chart prepared by James Stanley; EUR/USD on Tradingview
GBP/USD: Cable Support Holds – but Can Bulls Maintain?
Also in that analyst pick last week I had looked at the long side of Cable as, perhaps, one of the few attractive venues to work with USD strength.

The logic was laid out in that article but largely driven by the fact that the sell-off in Cable had stalled around a Fibonacci level while USD-strength continued very visibly against other currencies such as the Euro, AUD, etc. But – now that support has pushed a short-term higher-high in Cable, the question is whether the pair may have some more? This puts emphasis on a zone of higher-low support potential running from the approximate 1.2785-1.2815, outlined in red on the chart below.
GBP/USD Four-Hour Price Chart
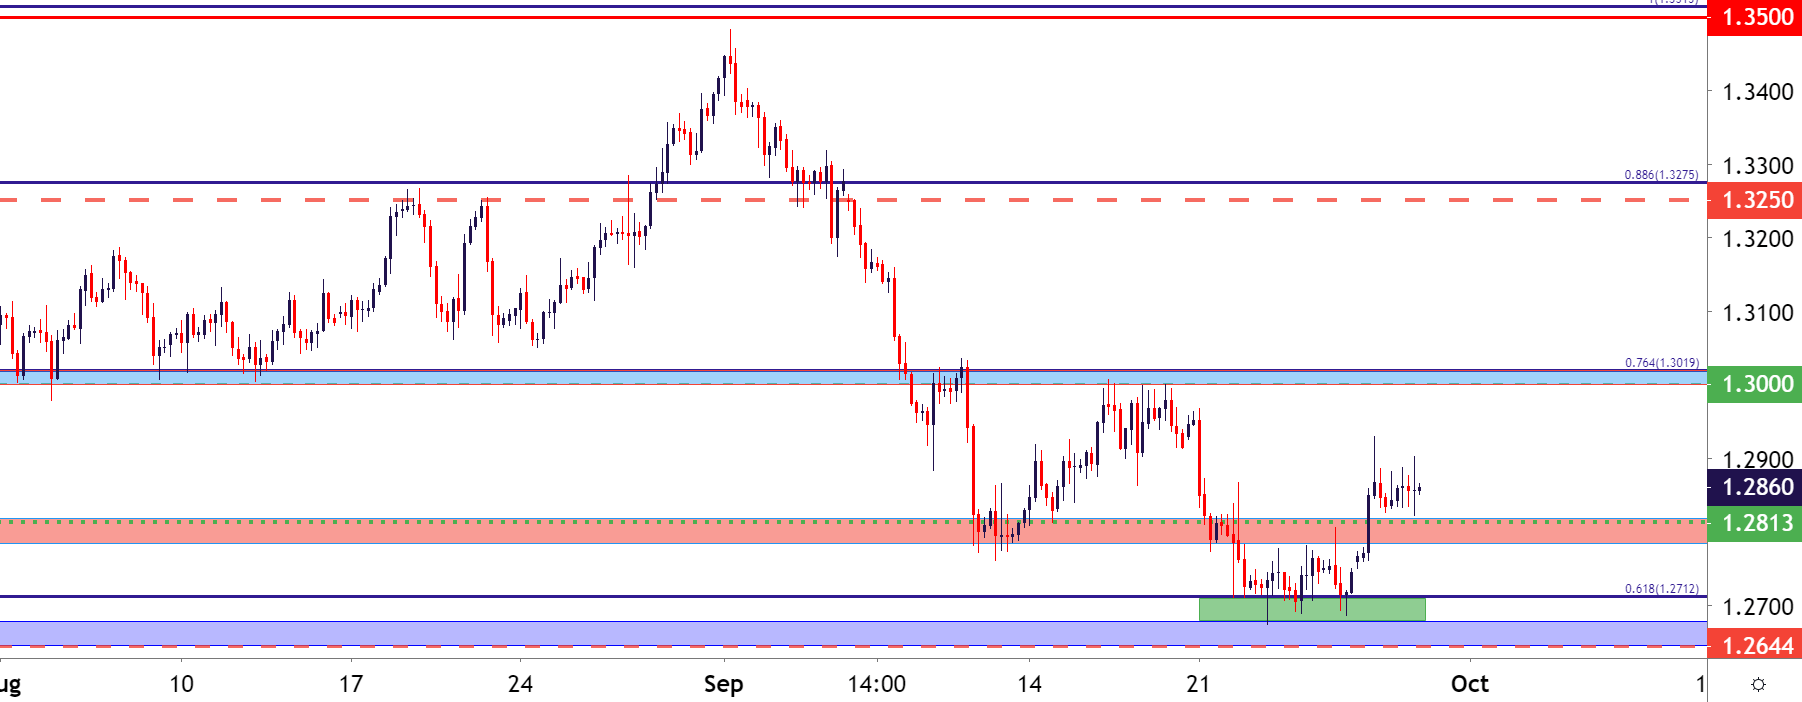
Chart prepared by James Stanley; GBP/USD on Tradingview
AUD/USD Bounce Finds Resistance
It’s been a busy month in AUD/USD. Coming into last week, I had warned that the pair might be setting up to reverse. And last week saw that theme play out with aggression as AUD/USD fell by more than 300 pips at one point.
But – as looked at last week after the .7000 psychological level came into play, the pair may be due a bounce, and that’s continued to play-out through this week. So far today, that bounce is facing its first real test, finding some resistance at the 61.8% retracement of the 2018-2020 major move. A little-higher on the chart, from around .7185-.7205, is another zone of potential resistance.
AUD/USD Four-Hour Price Chart
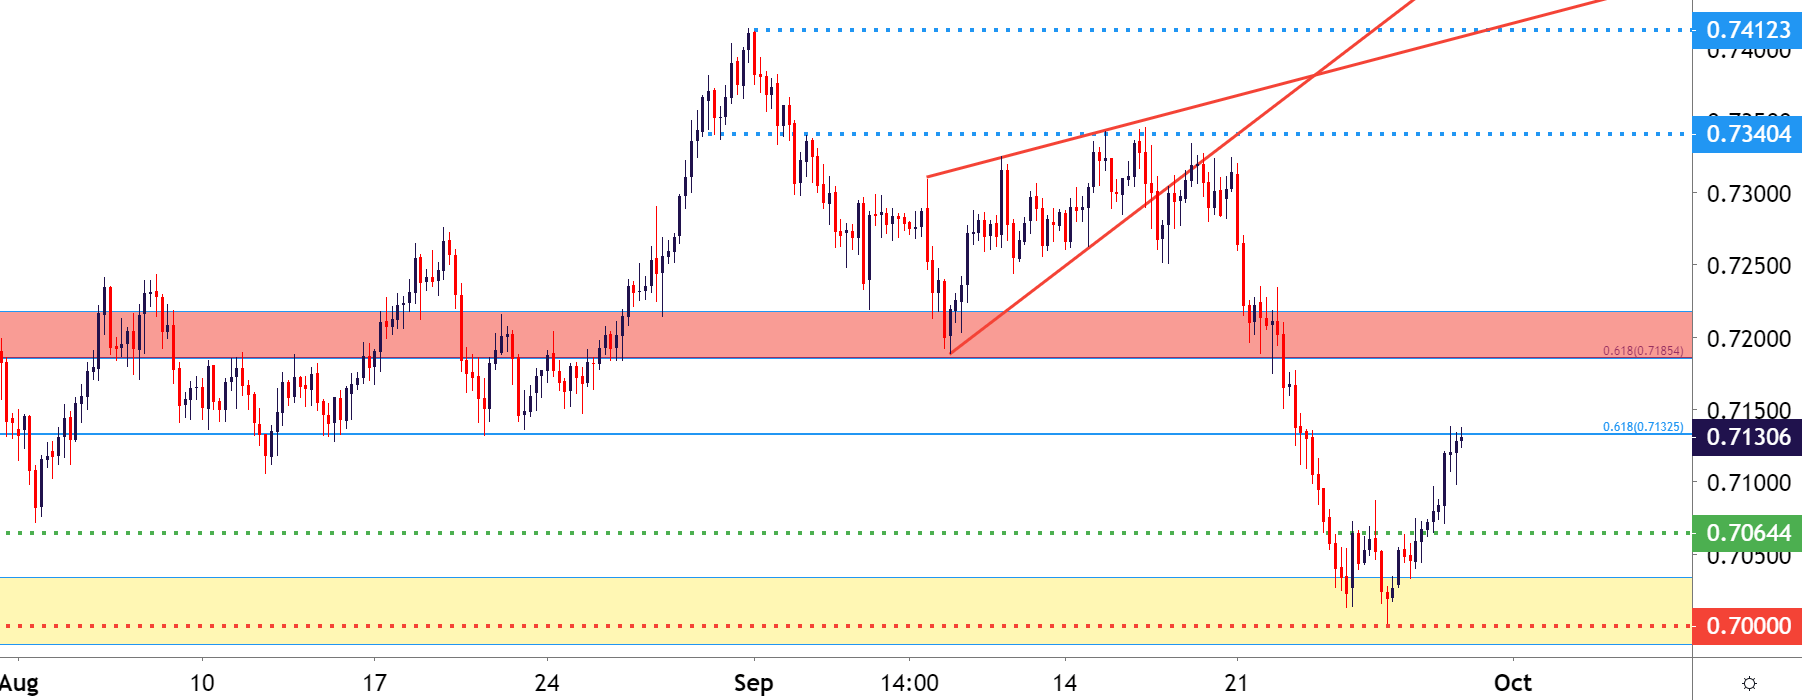
Chart prepared by James Stanley; AUD/USD on Tradingview
--- Written by James Stanley, Strategist for DailyFX.com
Contact and follow James on Twitter: @JStanleyFX


