


US Dollar Price Forecast:
- The US Dollar is pulling back from what’s become a strong outing in the month of September.
- Before the September bounce, USD was in a bearish state since the quick spike in March was faded out.
- The economic calendar for the remainder of this week is loaded with high-impact US items on the docket for each day of the week, capped by Non-Farm Payrolls on Friday.
- The analysis in this article heavily utilizes price action and chart patterns. To learn more about price action, check out our DailyFX Education section, where it’s taught amongst a host of other candlestick patterns and formations.
There’s now less than 48 hours until the Q4 open and the US Dollar is giving back some recent gains as Q3 winds down. The month of September so far has been quite the change of pace, as a persistent sell-off in USD finally ran into some element of support earlier in the month, and buyers have been in action ever since. Much of this bullish move developed last week, following a quick support test after trading opened for the week which was followed by an outsized showing from USD-bulls.
US Dollar Monthly Price Chart
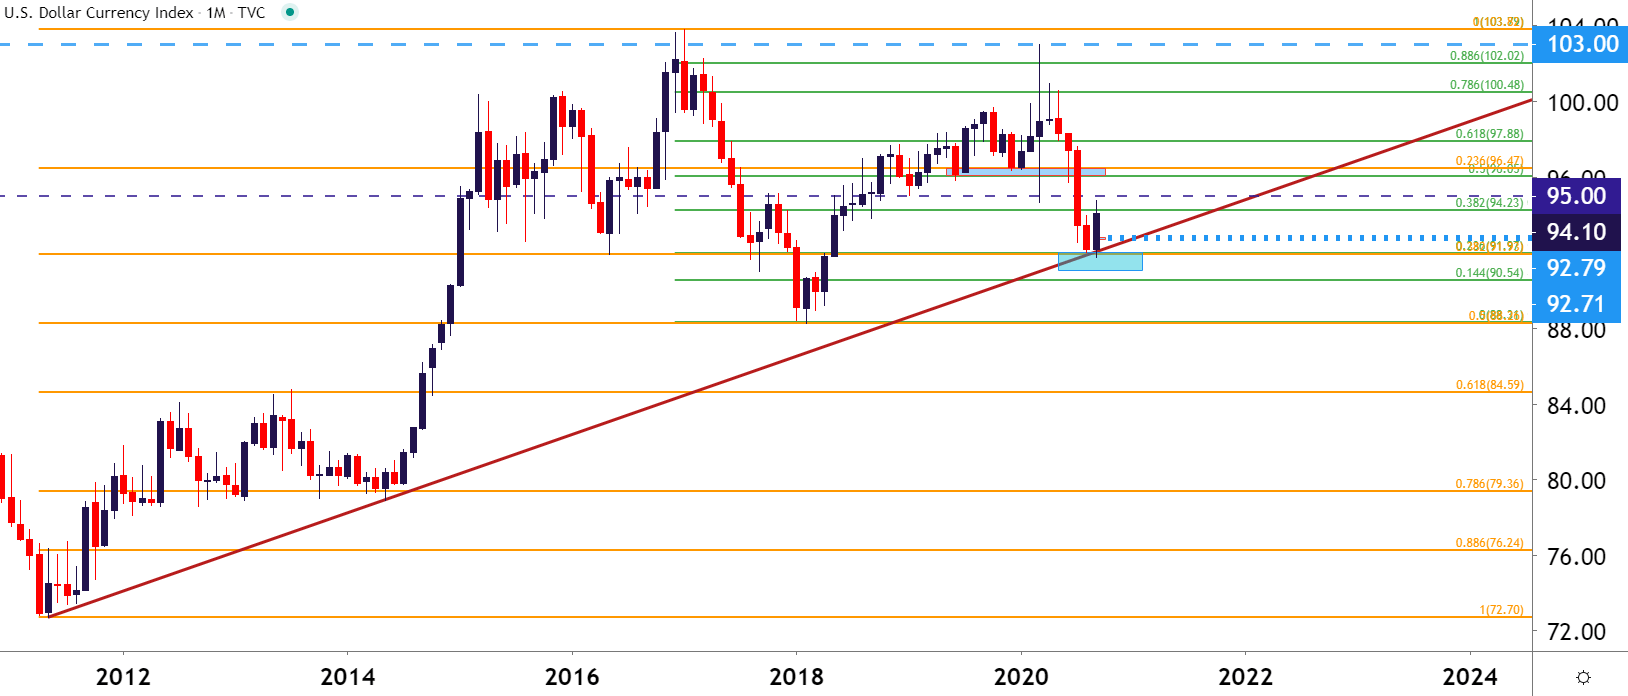
Chart prepared by James Stanley; USD, DXY on Tradingview
USD Strength Faces High-Impact US Data
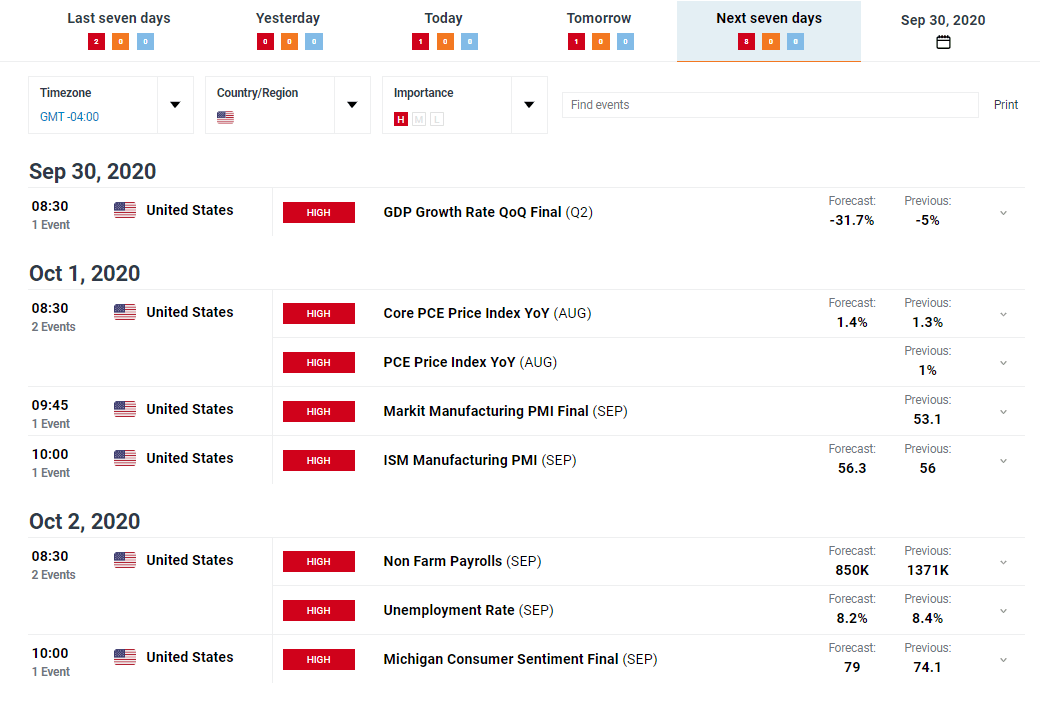
That theme faces its first real test this week as a flurry of data points out of the US will prod that next directional move in the currency. Today at 10AM ET brings consumer confidence numbers, and tomorrow brings final Q2 GDP readings. But it’s the day after when the plot thickens as we’ll get both PMI numbers to go along with PCE; and then Friday brings the big one with Non-Farm Payrolls. Collectively – this will give markets a look at both inflation pressure and employment, along with forward-looking expectations and this can help to round out the picture of what market participants are looking at as we head into the final quarter of what’s been a fairly unique year of 2020.

DailyFX Economic Calendar: High-Impact US Releases Remaining for This Week
US Dollar’s Bearish Backdrop In Question Ahead of Q4 Open
Has the US Dollar reversed its bearish course? We still can’t say one way or the other yet, at least not definitively.
The Greenback was engaged in a consistent sell-off ever since the quick spike in March, and that sell-off soon brought fresh two-year-lows into the mix just a few months after the currency set a fresh three-year-high. But, there were a plethora of reasons for that sell-off, least of which was FOMC policy and an aggressive move down to the lower bound of rates. This act of driving interest rates lower helped to also push capital into riskier assets, such as tech stocks, so there was a logical relationship for much of the summer in which both USD weakness and equity strength ruled the day.
Both of those themes have come into question in September as stocks started to pull back while the USD began its bounce from support. Permeating the backdrop this month along with those moves is a bit of skepticism around that next round of stimulus, coupled with a massive dose of uncertainty as the US wrestles with both a pensive Presidential Election and an ongoing pandemic of worsening proportions.
At this point, the September bounce in USD has retraced approximately 23.6% of the move since March and around 38.2% of the move that’s posted from the June 30 high. That 38.2% marker of the June-September major move appears to be helping with short-term support, taken from around the 94.00 handle.
US Dollar Daily Price Chart
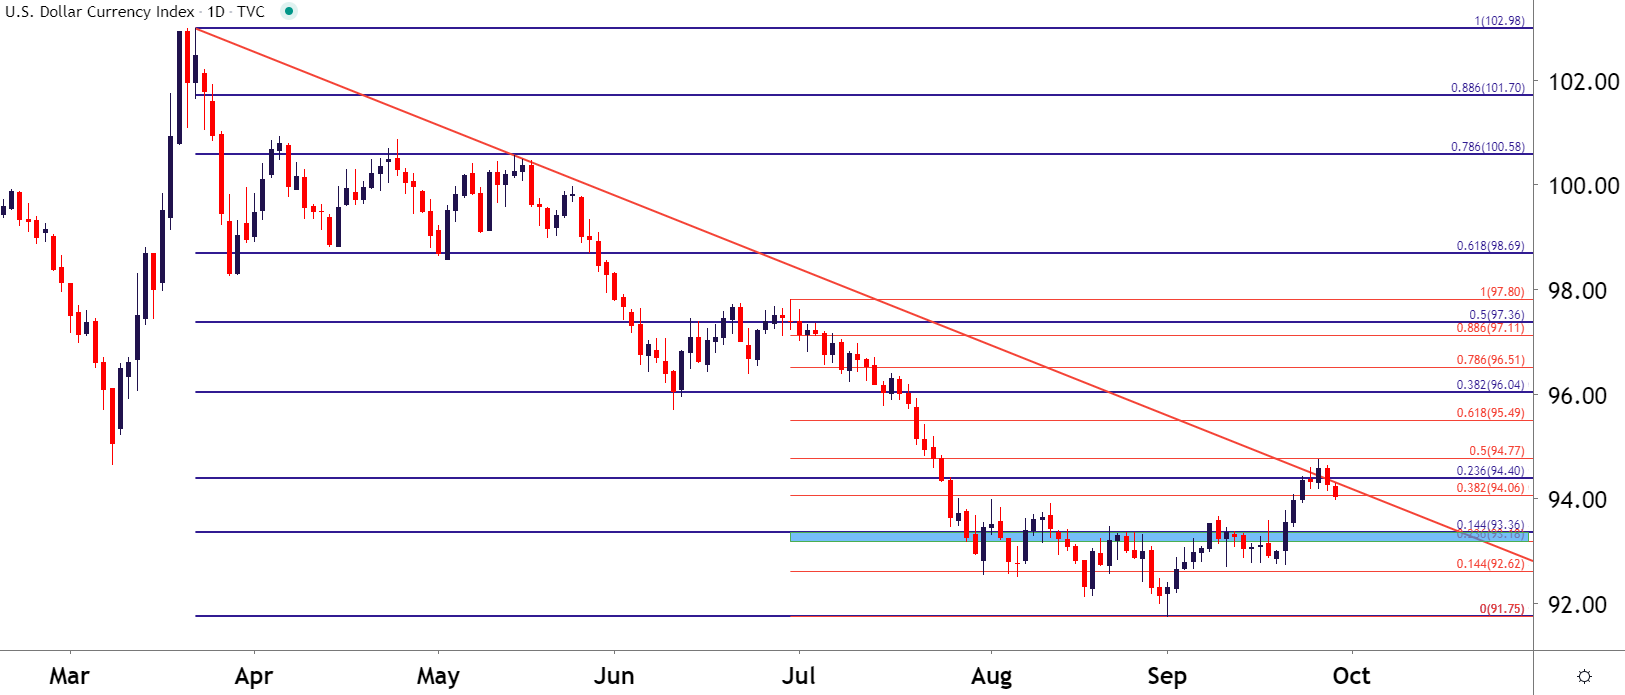
Chart prepared by James Stanley; USD, DXY on Tradingview
Taking a more granular look at the matter, and incorporating a Fibonacci retracement around the September bullish move, will help to provide some additional context to near-term USD price action. The 38.2% retracement of the June-September move is confluent with the 23.6% marker of the September bump; and a bit lower, around 93.60, is another area of short-term support potential.

Of key interest, especially with a heavy outlay on the economic calendar over the next few days – is the confluent support zone that runs from around 93.18-93.36. In this area on the chart are retracements from all three of the above major moves; offering a bit of confluent should the USD pullback with aggression ahead of the Friday NFP report.
US Dollar Four-Hour Price Chart
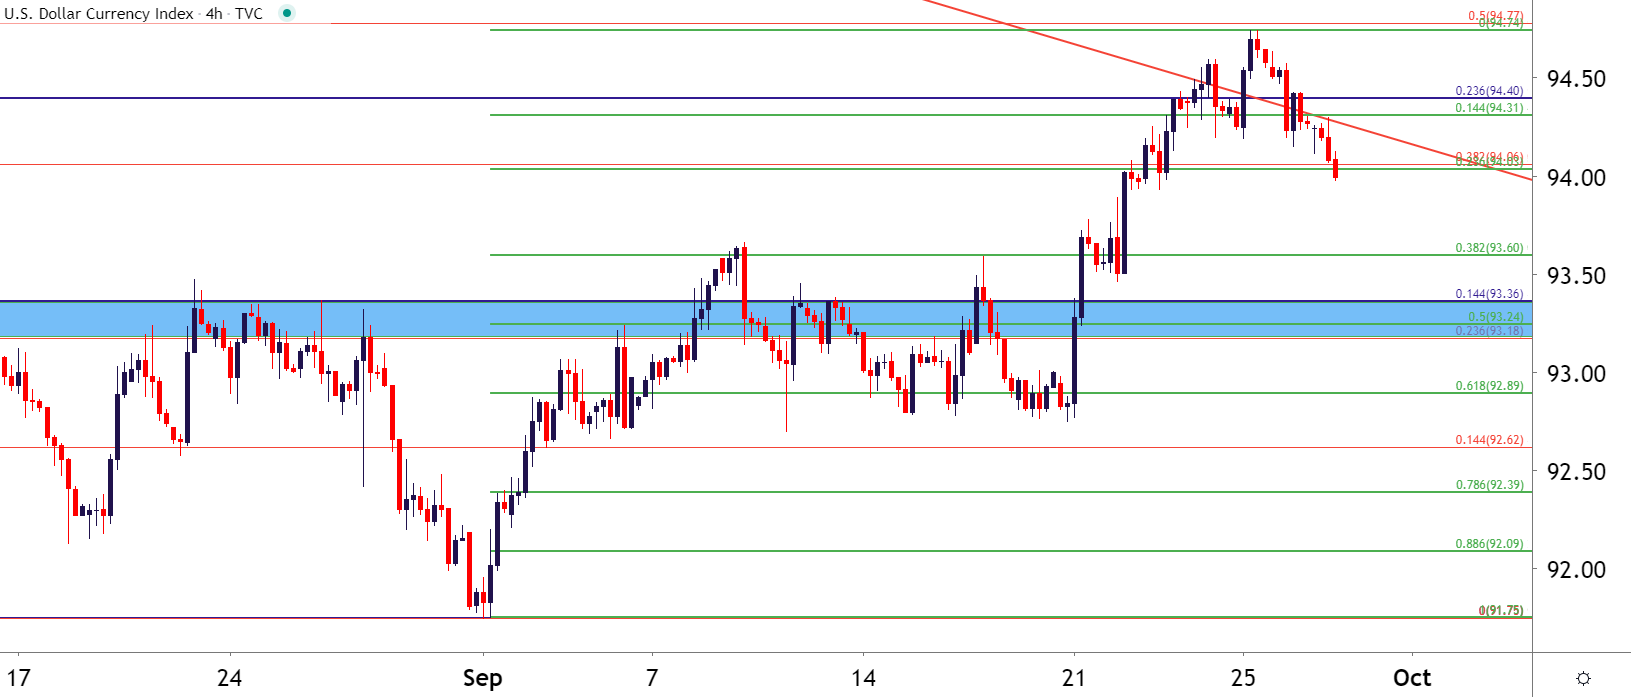
Chart prepared by James Stanley; USD, DXY on Tradingview
--- Written by James Stanley, Strategist for DailyFX.com
Contact and follow James on Twitter: @JStanleyFX


