The Elliott wave patterns for Ethereum and EUR/USD show potential for continued rallies while the US Dollar may enter a period of weakness.
The video above is a recording of a US Opening Bell webinar from October 28, 2019. We focused on the Elliott wave patterns for key markets such as Ethereum, US Dollar Index, EUR/USD, GBP/USD, and USD/JPY.
Ethereum Price Outlook for More Gains
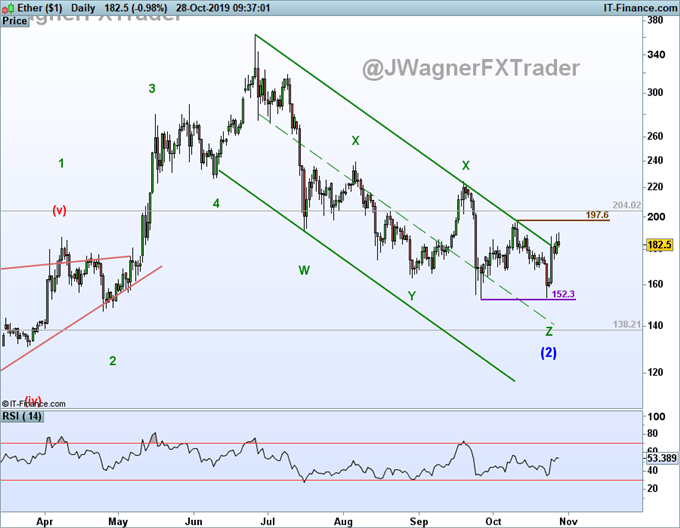
Ether jumped this past Friday pushing the market above a resistance trend line that has been containing prices for the past four months. This trend line break does suggest the mood of this market is changing from a bearish correction to a bullish move.
We forecasted on October 11 that a large rally may be nearby for cryptocurrency. After the dip on October 23, the bullish advances do appear more constructive and impulsive. A continued advance above 197.6 would create a series of higher highs and higher lows and open the door to 364 and possibly higher levels.
Further reading:
Ethereum Market Update: ETH/USD Price Outlook is Bullish

US Dollar Index Consolidates Support Break
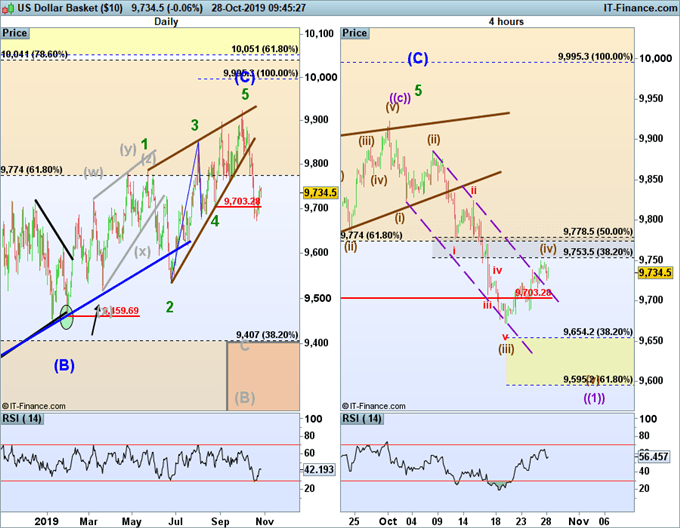
US Dollar Index is currently consolidating after the recent support trend line break. From an Elliott wave perspective, the October 1 high appears very important as several wave pictures point towards a retracement down to 94.60. From there, some of the models diverge with some wave counts pointing to even lower levels into the 80’s.
The current upwards consolidation fits well as a wave (iv). If this wave picture is correct, then continued selling resumes from nearby levels pushing closer to 94.60. There appears to be many more waves lower with the October 1 high of 99.23 key to the bearish bias.
Read also: how to trade US Dollar Index

EUR/USD Eyes Further Gains
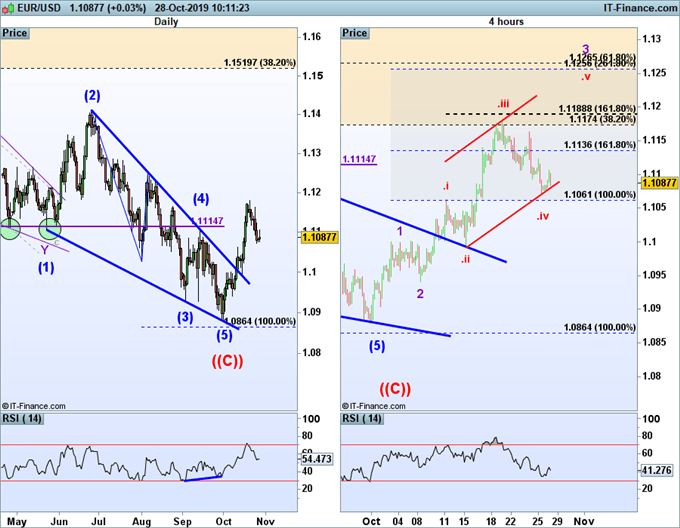
The resistance trend line break and top side retest of the same line keeps the forecasted rally alive for EURUSD. The dip from October 21 is taking the shape of a temporary correction. The key level we have been watching is 1.1063 and prices have held above this level so far.
Therefore, a rally may ensue from nearby levels to above 1.12. If this plays out, then the rally in EURUSD would be the last jump in wave 3 making the wave labeled as .v of 3. This implies more potential to the upside and the rally may be incomplete. We are targeting 1.18 and possibly higher levels for EUR/USD.

USD/JPY Bullish Trend Searches for a Top
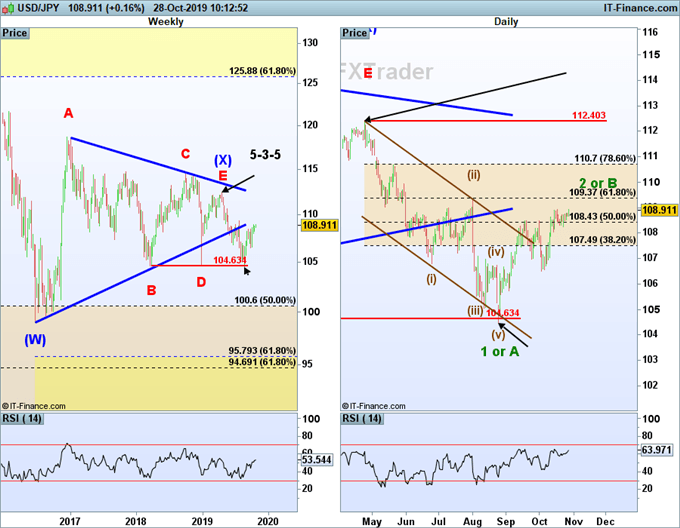
USD/JPY has nearly retraced 61.8% of the April to August 2019 downtrend. The structure of the advance from August has us viewing this uptrend as temporary and a partial retracement of the previous down wave. Therefore, this bearish view is maintained so long as USDJPY remains below 112.40. When this up wave finalized, we are anticipating a new down trend that eventually breaks below the August low of 104.46.
Therefore, the current Elliott wave for USDJPY appears to be wave 2 or B. When this wave terminates, the next wave lower would be wave 3 or C.

Learn more on Elliott wave including the rules and guidelines by grabbing these beginners and advanced Elliott Wave trading guides.
After reviewing the guides above, be sure to follow future Elliott Wave articles to see Elliott Wave Theory in action.
---Written by Jeremy Wagner, CEWA-M
Jeremy Wagner is a Certified Elliott Wave Analyst with a Master’s designation. Jeremy provides Elliott Wave analysis on key markets as well as Elliott Wave educational resources. Read more of Jeremy’s Elliott Wave reports via his bio page.
Join Jeremy in his live US Opening Bell webinar where these markets and more are discussed through Elliott wave theory.
Follow Jeremy on Twitter at @JWagnerFXTrader .
Recent Elliott Wave analysis you might be interested in…
EURUSD Elliott Wave forecast – enough evidence points to a large rally


