


EURUSD Elliott Wave Talking Points:
- Downtrend wave that began February 2018 is close to being over (if it isn’t finalized already)
- Ending diagonal pattern behaving like the downtrend is complete
- Large bullish rally to 1.18 and possibly above 1.22 is the next anticipated move under Elliott Wave Theory
The EUR/USD 20 Month Downtrend Complete?
Many traders have been anticipating the EURUSD would continue to weaken on the heels of the ECB suppressing rates. The current downtrend for EURUSD has been in place since February 16, 2018. Using Elliott wave principle, we forecasted the ending of the rally and a large corrective wave on February 8, 2018 that may drive EURUSD lower to 1.15 and possibly 1.09-1.12.
There is enough evidence to consider the minimum waves are in place for this 20-month downtrend to be counted as over. I’m counting this 20-month trend as a bearish zigzag pattern. Wave ((C)) of this ((A))-((B))-((C)) pattern is considered an ending diagonal pattern. If this analysis is correct, then EUR/USD may stage a large bullish reversal that may initially rally to 1.18 with secondary targets above 1.22.

EURUSD Ending Diagonal pattern complete?
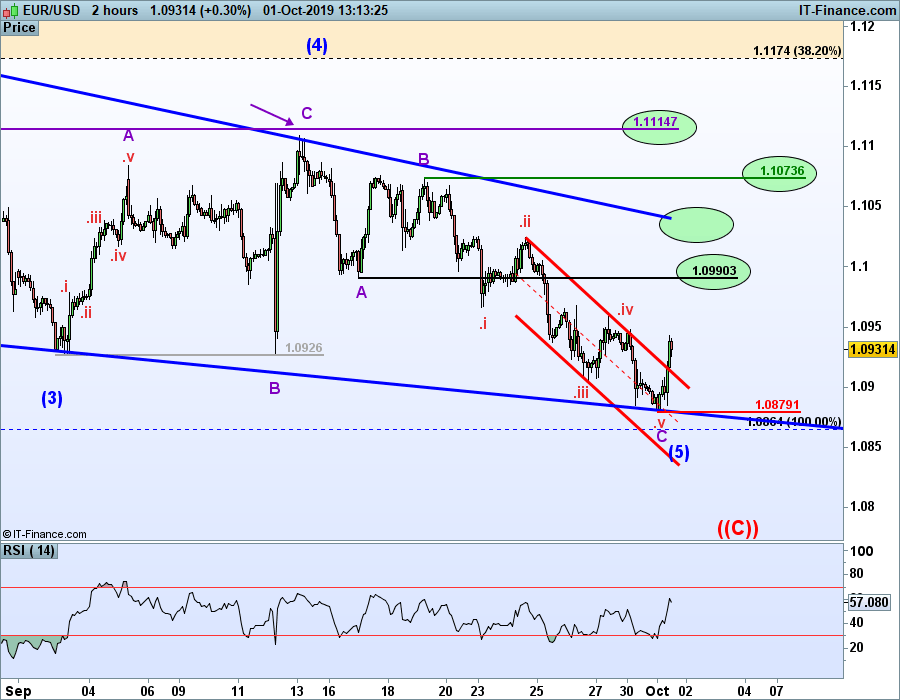
The Elliott wave ending diagonal pattern is a 5-wave pattern that appears wedge shaped. The fifth and final wave of this pattern would be a zigzag pattern labeled A-B-C that began September 13, 2019. The ‘C’ wave, if finished, has some interesting characteristics to it that hints it is over terminating the whole pattern.
First, wave .v of C only made it to the mid-line of the .ii-.iv channel. The inability to move beyond the midline suggests there is strength building from within.
Second, the proposed terminal price of wave .v and C is at the blue trend line shaping the ending diagonal pattern of the larger wave ((C)).
Lastly, the subsequent rally from today’s low has penetrated the .ii-.iv channel resistance line. This break signifies the previous impulse wave that began September 19 is complete.
We hinted in yesterday’s Elliott wave webinar that a large rally may begin from nearby levels.
For those familiar with Elliott Wave Theory, ending diagonals are patterns that tend to be quickly retraced to its beginning. The beginning of this diagonal pattern is the September 2018 high near 1.18.
What is the current EURUSD Elliott wave?
Assuming this analysis is correct, it is high probability that the February 2018 to October 2019 wave was an (X) wave of large degree. If so, then the start of another long bullish wave is likely underway to new highs above 1.25.
A second option is that this 20-month downtrend is wave ‘A’ of a larger (X) wave triangle. If this is the case, a rally would likely ensue to 1.18 – 1.30 with several more years of sideways chop. Plenty of trading opportunities, but perhaps continued frustration like what we’ve seen in 2019.
A third potential is this 20-month bearish zigzag is wave 1 of a large degree bearish ending diagonal pattern. Under this scenario, a large rally likely drives to near 1.18-1.20 in wave 2. Further waves would carve to the downside after that.
EURUSD Elliott wave Count
As a result, many of the Elliott wave patterns in EUR/USD point to 1.18. From there, some of the patterns diverge towards new highs, while others pivot back towards current lows.
Further confidence can be added to a large rally back to 1.18 upon resistance levels breaking.
First, a break above 1.0990 creates overlap with wave ‘A’ of (5). This is the next step to building confidence in this wave count.
If a break above 1.0990 is successful, then watch the (2)-(4) ending diagonal trendline.
A break above 1.1074 would clear wave ‘B’ of (5) high and set the stage for a final resistance test of the wave (4) high and long-term horizontal support/resistance of 1.1115.
The conservative route in my opinion, is waiting for a break above 1.1115.
Learn more about common Elliott wave patterns by reviewing the beginners and advanced Elliott wave guides.
---Written by Jeremy Wagner, CEWA-M
Jeremy Wagner is a Certified Elliot Wave Analyst with a Master’s designation. Jeremy provides Elliot wave analysis on key markets as well as Elliott wave education resources. Read more of Jeremy’s Elliott wave reports via his bio page.
Communicate with Jeremy and have your shout below by posting in the comments area. Feel free to include your Elliott wave count as well.
Discuss these markets with Jeremy in Monday’s US Opening Bell webinar.
Follow Jeremy on twitter at @JWagnerFXTrader .


