


The rest of this week brings a busy economic calendar filled with high-impact events, and most major currency pairs will be in focus as we get key rate decisions out of the Fed and Bank of England, along with the release of Non-Farm Payrolls data on Friday morning. This comes on the heels of what’s already been a busy week with last night’s Bank of Japan rate decision and this morning’s batch of European items, including July inflation and Q2 GDP.
Talking Points:
- If you’re looking to improve your trading approach, our Traits of Successful Traders research could help. This is based on research derived from actual results from real traders, and this is available to any trader completely free-of-charge.
- If you’re looking for a primer on the FX market, we can help. To get a ground-up explanation behind the Forex market, please click here to access our New to FX Trading Guide.
If you’d like to sign up for our webinars, we host an event on Tuesday and Thursday, each of which can be accessed from the below links:
Tuesday: Tuesday, 1PM ET
Thursday: Thursday 1PM ET
US Dollar Continues Knocking on Support
The bullish trend-line in the US Dollar continues to hold support, and that trend-line has now run into the Fibonacci zone that runs from 94.20-94.30. We did see some upward movement this morning from a bounce off of this area, but bulls haven’t yet been able to push up to a re-test of 94.75 or 94.90. This urges caution as we approach tomorrow’s FOMC rate decision and Friday’s Non-Farm Payrolls data. There’s deeper support structure in USD, specifically looking at 93.71 which helped to produce the July swing low or 93.20-93.30 that helped to hold the lows in June.
US Dollar Four-Hour Price Chart: Continued Test of Key Support
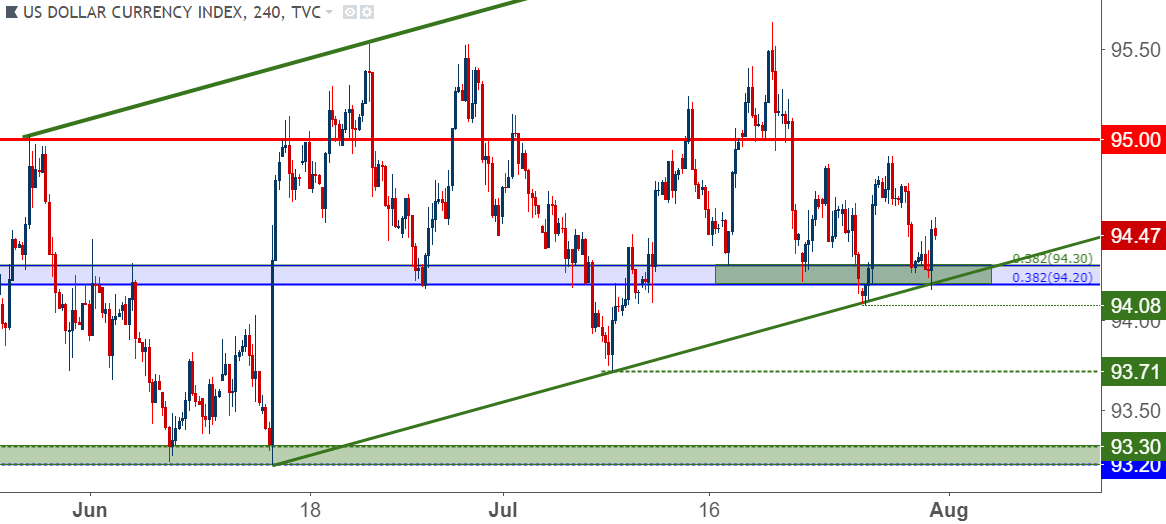
Chart prepared by James Stanley
EUR/USD Deeper into the Wedge
The symmetrical triangle continues to hold EUR/USD price action, and the pair hasn’t yet shown much for trends so far in Q3. European data, on the other hand, continues to show inflation above the ECB’s 2% target. This was partially offset by a slight disappointment in this morning’s Q2 GDP release, which came in at 2.1% versus the expectation of 2.2%. But – the bar for a stronger Euro appears relatively low, as the ECB previously said that they’re planning to keep rates at current levels ‘at least through the summer of 2019.’ Will they be able to continue sitting on negative rates as inflation runs higher? We saw this theme getting priced in for much of last year, and the potential exists for that scenario to show again in the second half of 2018.
For now – price action is displaying no such trend, so I’m not looking at directional strategies until that changes.
EUR/USD Four-Hour Price Chart: Driving Deeper into the Wedge

Chart prepared by James Stanley
GBP/USD In-Focus Ahead of BoE Super Thursday
We looked into the pair yesterday and the setup here is largely the same. The down-trend in the British Pound has been fairly pronounced since mid-April. This is when inflation took a downturn and, as of yet, hasn’t fully recovered. Inflation in March came in at 2.5% and since then, we've had three consecutive months print at 2.4%. But – after the BoE held off of a May rate hike, we saw three dissenting votes for a hike in June. Since then we’ve seen growing probabilities for a 25 basis point adjustment at Thursday’s rate decision, and with this meeting being a ‘Super Thursday’ event, we’re also getting updated forecasts out of the bank.
This could, potentially, bring in a resistance test at the descending trend-line taken from the June and July swing highs.
GBP/USD Four-Hour Price Chart
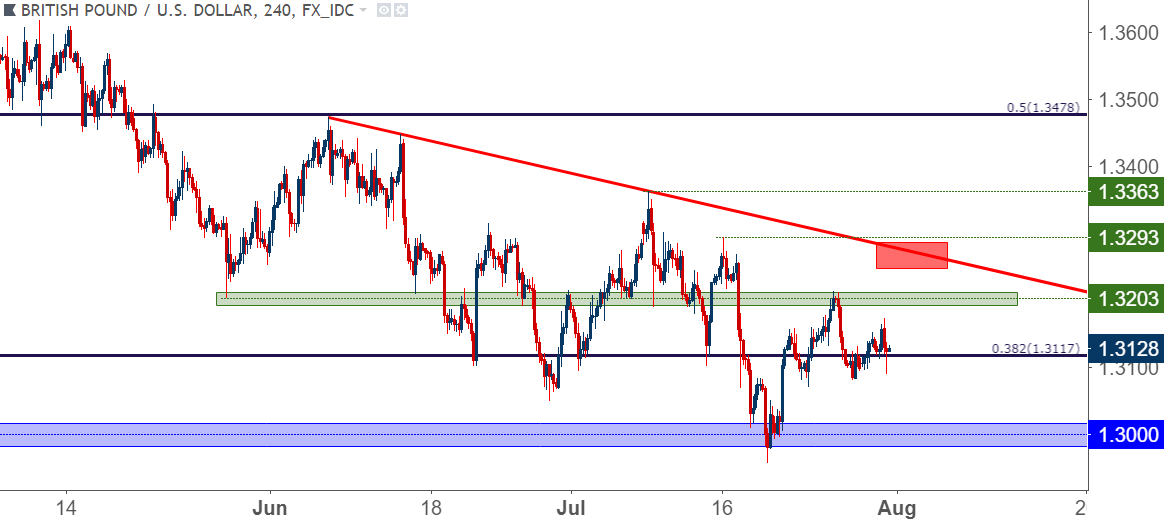
Chart prepared by James Stanley
USD/JPY Breaks Out After BoJ
We’ve been following the Yen throughout July as the currency started Q3 with a very visible bearish move (a bullish breakout in USD/JPY), bringing to the forefront the possibility of a continuation of Yen weakness. We looked at a bullish setup there last week that didn’t fill and, again this week we highlighted the pair in our FX setups of the week.
We discussed the Bank of Japan rate decision last night which appears to keep the BoJ on track to be one of the more loose and passive Central Banks in the world. This could keep the idea of Yen weakness as an attractive FX theme as we trade deeper into the year. This was one of the Q3 themes of interest that we highlighted ahead of July, and as this further comes to fruition, this highlights attraction in setups like EUR/JPY or perhaps even GBP/JPY (discussed during Q&A).
USD/JPY Daily Price Chart: Support Bounce After BoJ

Chart prepared by James Stanley
USD/CHF May Soon Bring Bearish Appeal
We had previously looked at an ascending triangle formation in the pair as resistance from parity up to 1.0055 was being coupled with a bullish trend-line drawn from the June and July swing lows. Yesterday saw that trend-line get taken out, and we’re now seeing some resistance form here. This can open the door to short-term bearish setups in the pair for those looking to move aggressively. Alternatively, traders can wait for a bearish test of .9850 before then looking to place stops above lower-high resistance around the trend-line.
USD/CHF Four-Hour Price Chart: Resistance at Prior Trend-Line Support
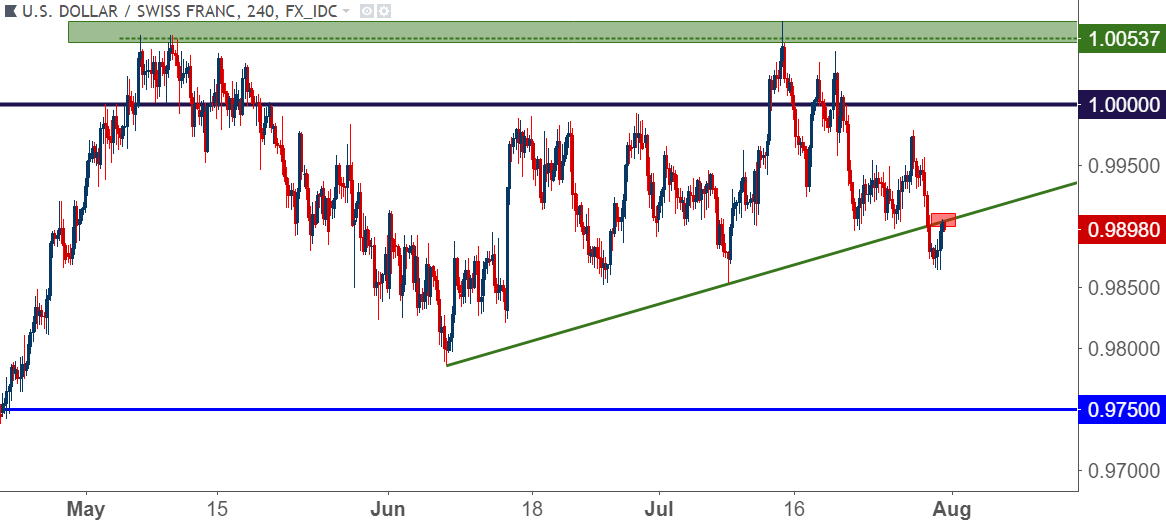
Chart prepared by James Stanley
EUR/JPY with Bullish Potential After Today’s Breakout
We had looked at the pair yesterday as we were approaching BoJ and this morning’s European data. Both series of events appeared to help out the topside of the pair, and with EUR/JPY now setting a fresh weekly high, the door is open for a support test at that prior area of resistance. That zone runs from 130.00-130.35, and this can open the door for stops to go below the swing-low at 129.09.
EUR/JPY Four-Hour Price Chart: Support Potential at Prior Resistance 130.00-130.35

Chart prepared by James Stanley
Gold Holds Support Going on Third Week
In this week’s fundamental forecast, we looked at Gold prices holding a key level of support for a second week. This is coming from the 50% marker of the 2014-2016 major move, and despite numerous tests below, sellers haven’t been able to make much ground beyond this support. This highlights the potential for resistance in the area that runs from around $1,235-$1,237 to look for bearish continuation strategies.
Gold Four-Hour Price Chart: Continued Hold of Support

Chart prepared by James Stanley
To read more:
Are you looking for longer-term analysis on the U.S. Dollar? Our DailyFX Forecasts for Q1 have a section for each major currency, and we also offer a plethora of resources on USD-pairs such as EUR/USD, GBP/USD, USD/JPY, AUD/USD. Traders can also stay up with near-term positioning via our IG Client Sentiment Indicator.
Forex Trading Resources
DailyFX offers a plethora of tools, indicators and resources to help traders. For those looking for trading ideas, our IG Client Sentiment shows the positioning of retail traders with actual live trades and positions. Our trading guides bring our DailyFX Quarterly Forecasts and our Top Trading Opportunities; and our real-time news feed has intra-day interactions from the DailyFX team. And if you’re looking for real-time analysis, our DailyFX Webinars offer numerous sessions each week in which you can see how and why we’re looking at what we’re looking at.
If you’re looking for educational information, our New to FX guide is there to help new(er) traders while our Traits of Successful Traders research is built to help sharpen the skill set by focusing on risk and trade management.
--- Written by James Stanley, Strategist for DailyFX.com
Contact and follow James on Twitter: @JStanleyFX


